

2023-2024 Premier League Season
Let's take a look back at the 2023-2024 Premier League season: a last-minute title race between the season's top 2 teams, and a fight to stay in the league at the bottom.
2024 - Kevin Nicolas
In this article, we will see overall statistics about football, with sub-categories about:
- Overall
- Players
- Teams
Overall
First, let's look at overall statistics about this season such as the number of goals per match in average, the number of type of goals or the most prolific week.
Scorers' starters/subs repartition 🔁
Sometimes, a substitute can change the match. I wanted to see the repartition of goals scored by starters and substitutes. Also, I wanted to see this repartition within teams, and see which team has more goals scored by substitutes, and inversely:
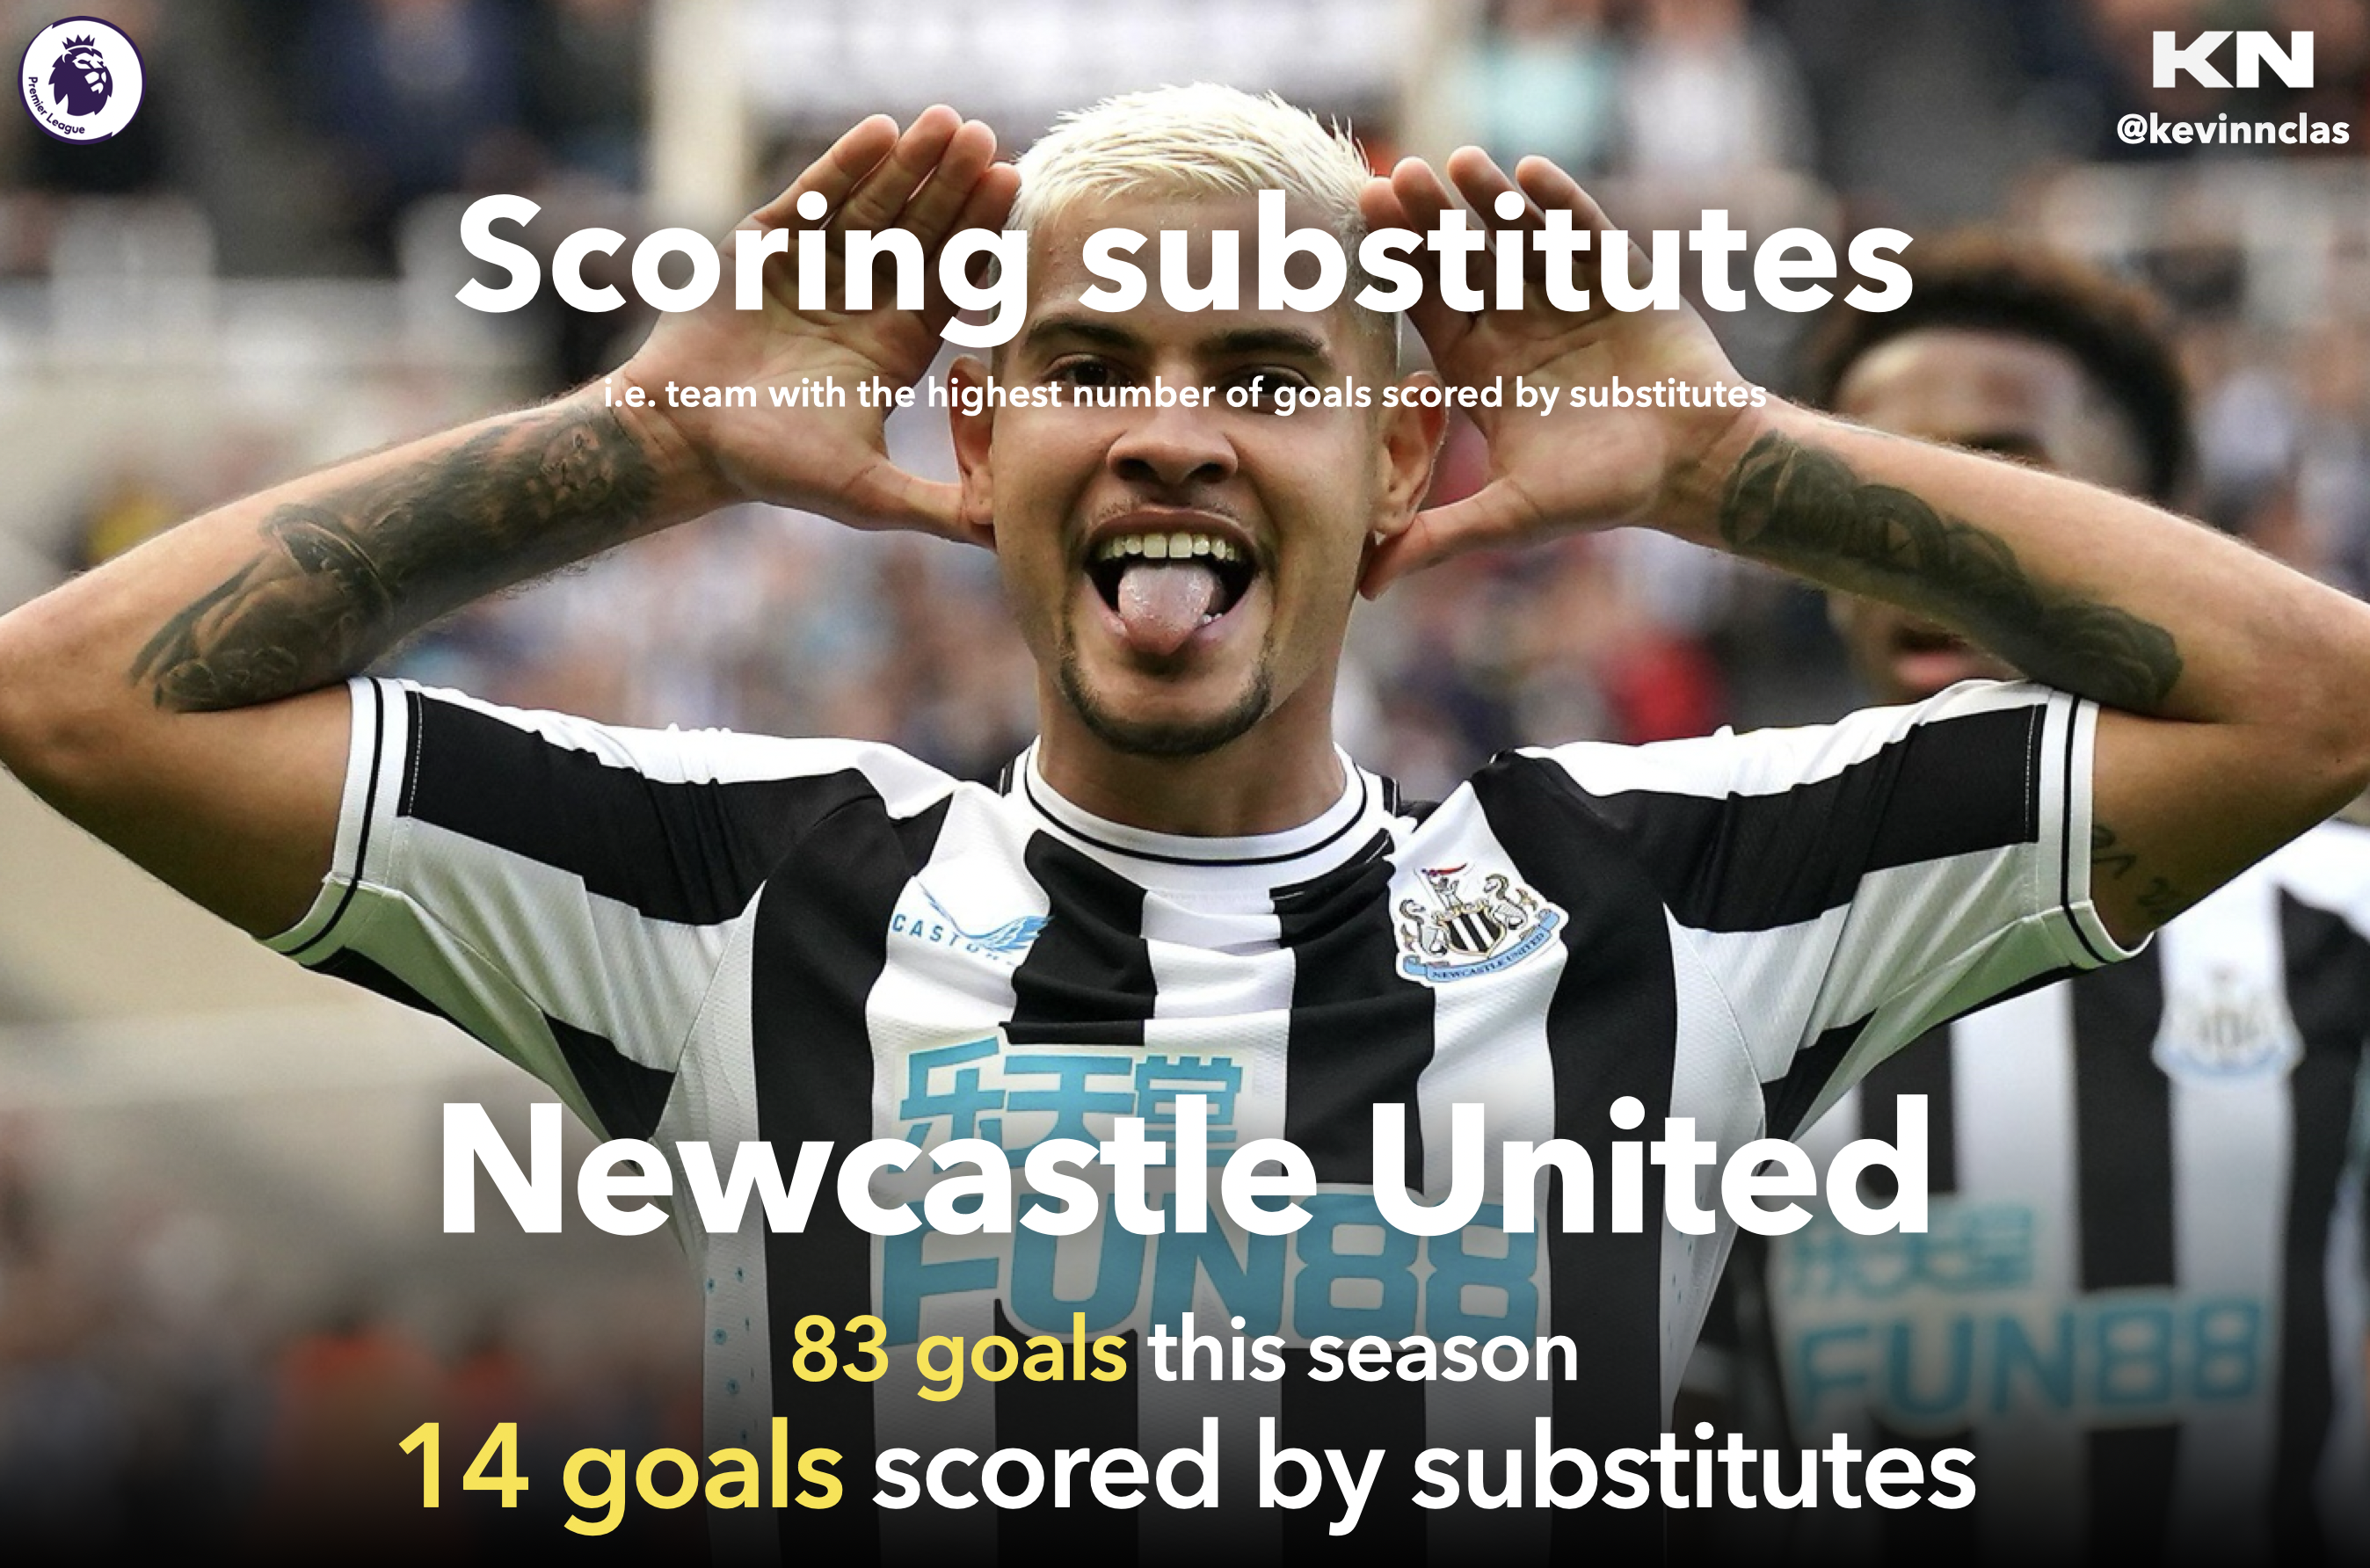
Newcastle Utd is the team with the most goals scored by subs, with a total of 14 goals, which represent more than 16% of their goals scored.
The team with the fewest substitutes scoring a goal is West Ham, with only 3 goals.
Type of goals scored depending scenario 🚩
A goal can be scored in several scenarios: during the course of play, a free kick or a corner.
Let's see the breakdown of all the goals scored:
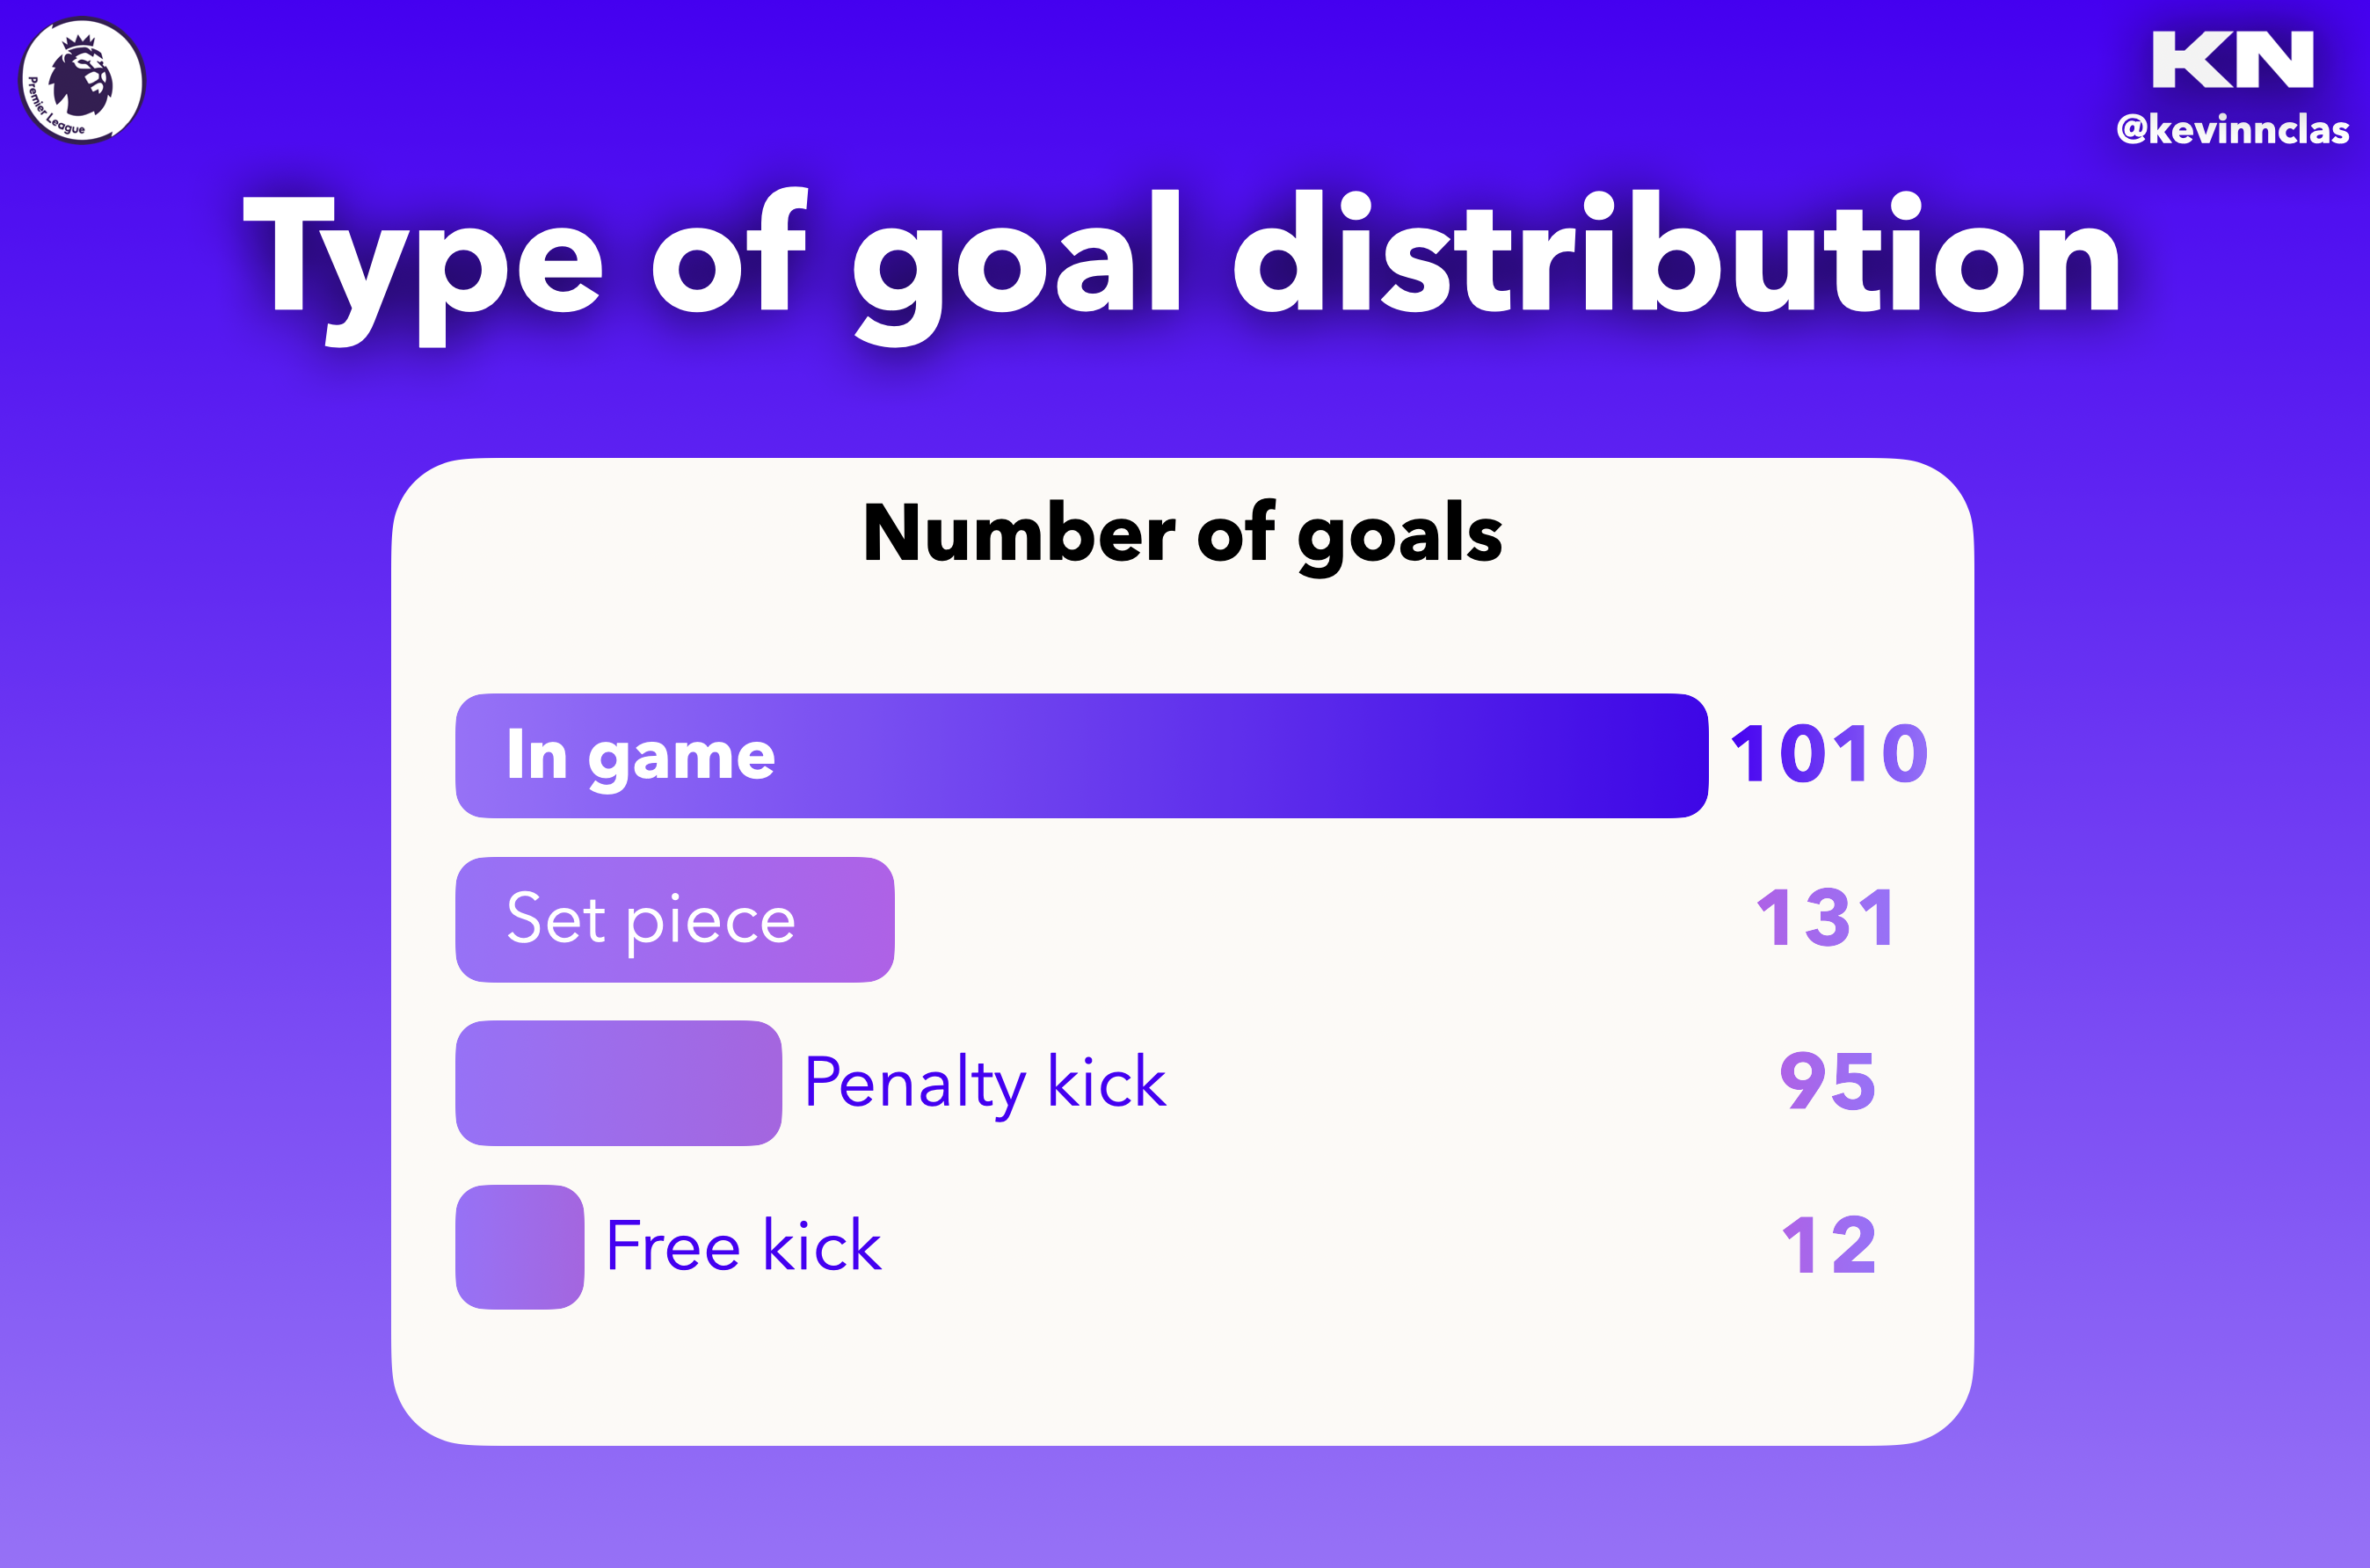
Logically, the most goals were scored during the game, with more than 80% of all scored goals.
However, we note that 95 goals were scored from penalties, which is not far from all the other goals scored from set pieces, excluding free kicks and penalty kicks (131 goals).
We will see the team distribution of these types of goals a little later.
Most prolific gameweek 🤑
Every weekend, we had the chance to experience memorable matches. But let's see which gameweek had the most goals scored:
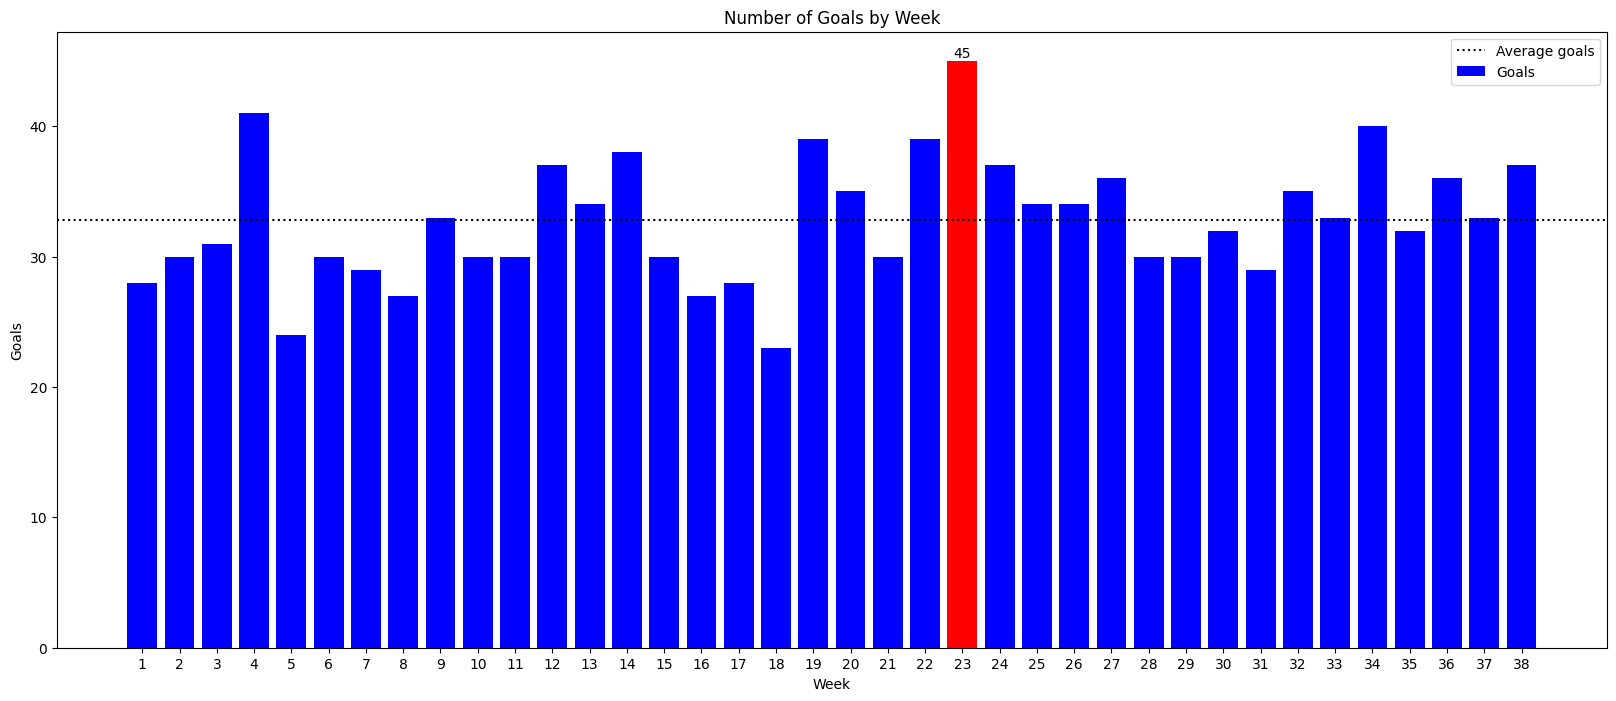
With 45 goals, the most prolific gameweek is Gameweek 23.
It happened at the beginning of February, and we can remember a few results:
We can see that the average goals scored each gameweek is approximatively 33 goals, which is one of the highest average in top 5 leagues in Europe.
Players
Here are some of the players who have impressed this season, based on their sportive performances.
Most decisive player 💯
In this section, I wanted to highlight the most decisive players offensively, who is the player who scored, made an assist or delivered a pass before an assist the most, i.e. the player who were closely involved in an action leading to a goal:

Leading this rank is Cole Palmer, who made an incredible season with 47 goals involved in the 77 goals scored by Chelsea.
More than 3 out of 5 goals scored by Chelsea involved Palmer, demonstrating his importance to his team's success.
Ollie Watkins, who was closely involved in over 59% of Vilains' goals, could not make the difference on his own for a place on the podium, as Aston Villa finished 4th in the table.
Best scorer & player with most assists 🏆
Let's find out who was the best scorer and the player who made the most assists in the league this season:

With 27 goals, Erling Haaland is the owner of this title, with an average PSxG* of 0,68.
*PSxG: The weaker PSxG is, the more unexpected and therefore beautiful the goals. On the contrary, the closer PSxG is to 1, the 'easier' the goals are to score.
Just right behind him, we have Cole Palmer with 22 goals and Alexander Isak with 21 goals.
The English and Swedish football teams' attack have a bright future ahead of them with these two players!
Concercing assists, the best player with 13 assists is Ollie Watkins.
We must not forget that he is the striker and also the best scorer of his team, which is such a great performance to be at this position for him. He was even named playmaker of the season! 👏
Best scorer & assist combined (G+A) 🏆
Now let's add assists to goals scored, to have the player who delivered the most assists and scored the most goals this season:

What a season this player made: Cole Palmer, with 33 G+A (22 goals and 11 assists).
The English player was really at the top of his art this season, followed very closely by another English player, Ollie Watkins with 32 G+A (19 goals and 13 assists).
Effectiveness 🚦
This graph will allow us to measure the efficiency of all the players in the league:
- I've chosen to calculate this indicator according to two criteria: the first is finishing efficiency, which is the difference between the number of goals scored and the number of expected goals.
- Thus, a player with a positive result scores more often than expected.
- The other criterion concerns altruism efficiency, in particular the player's ability to provide a good pass that can end up being decisive. This is done in the same way as the other criterion, by taking the difference between the number of assists made and the number of expected assists.
- Thus, a player with a positive result makes more assists than expected.
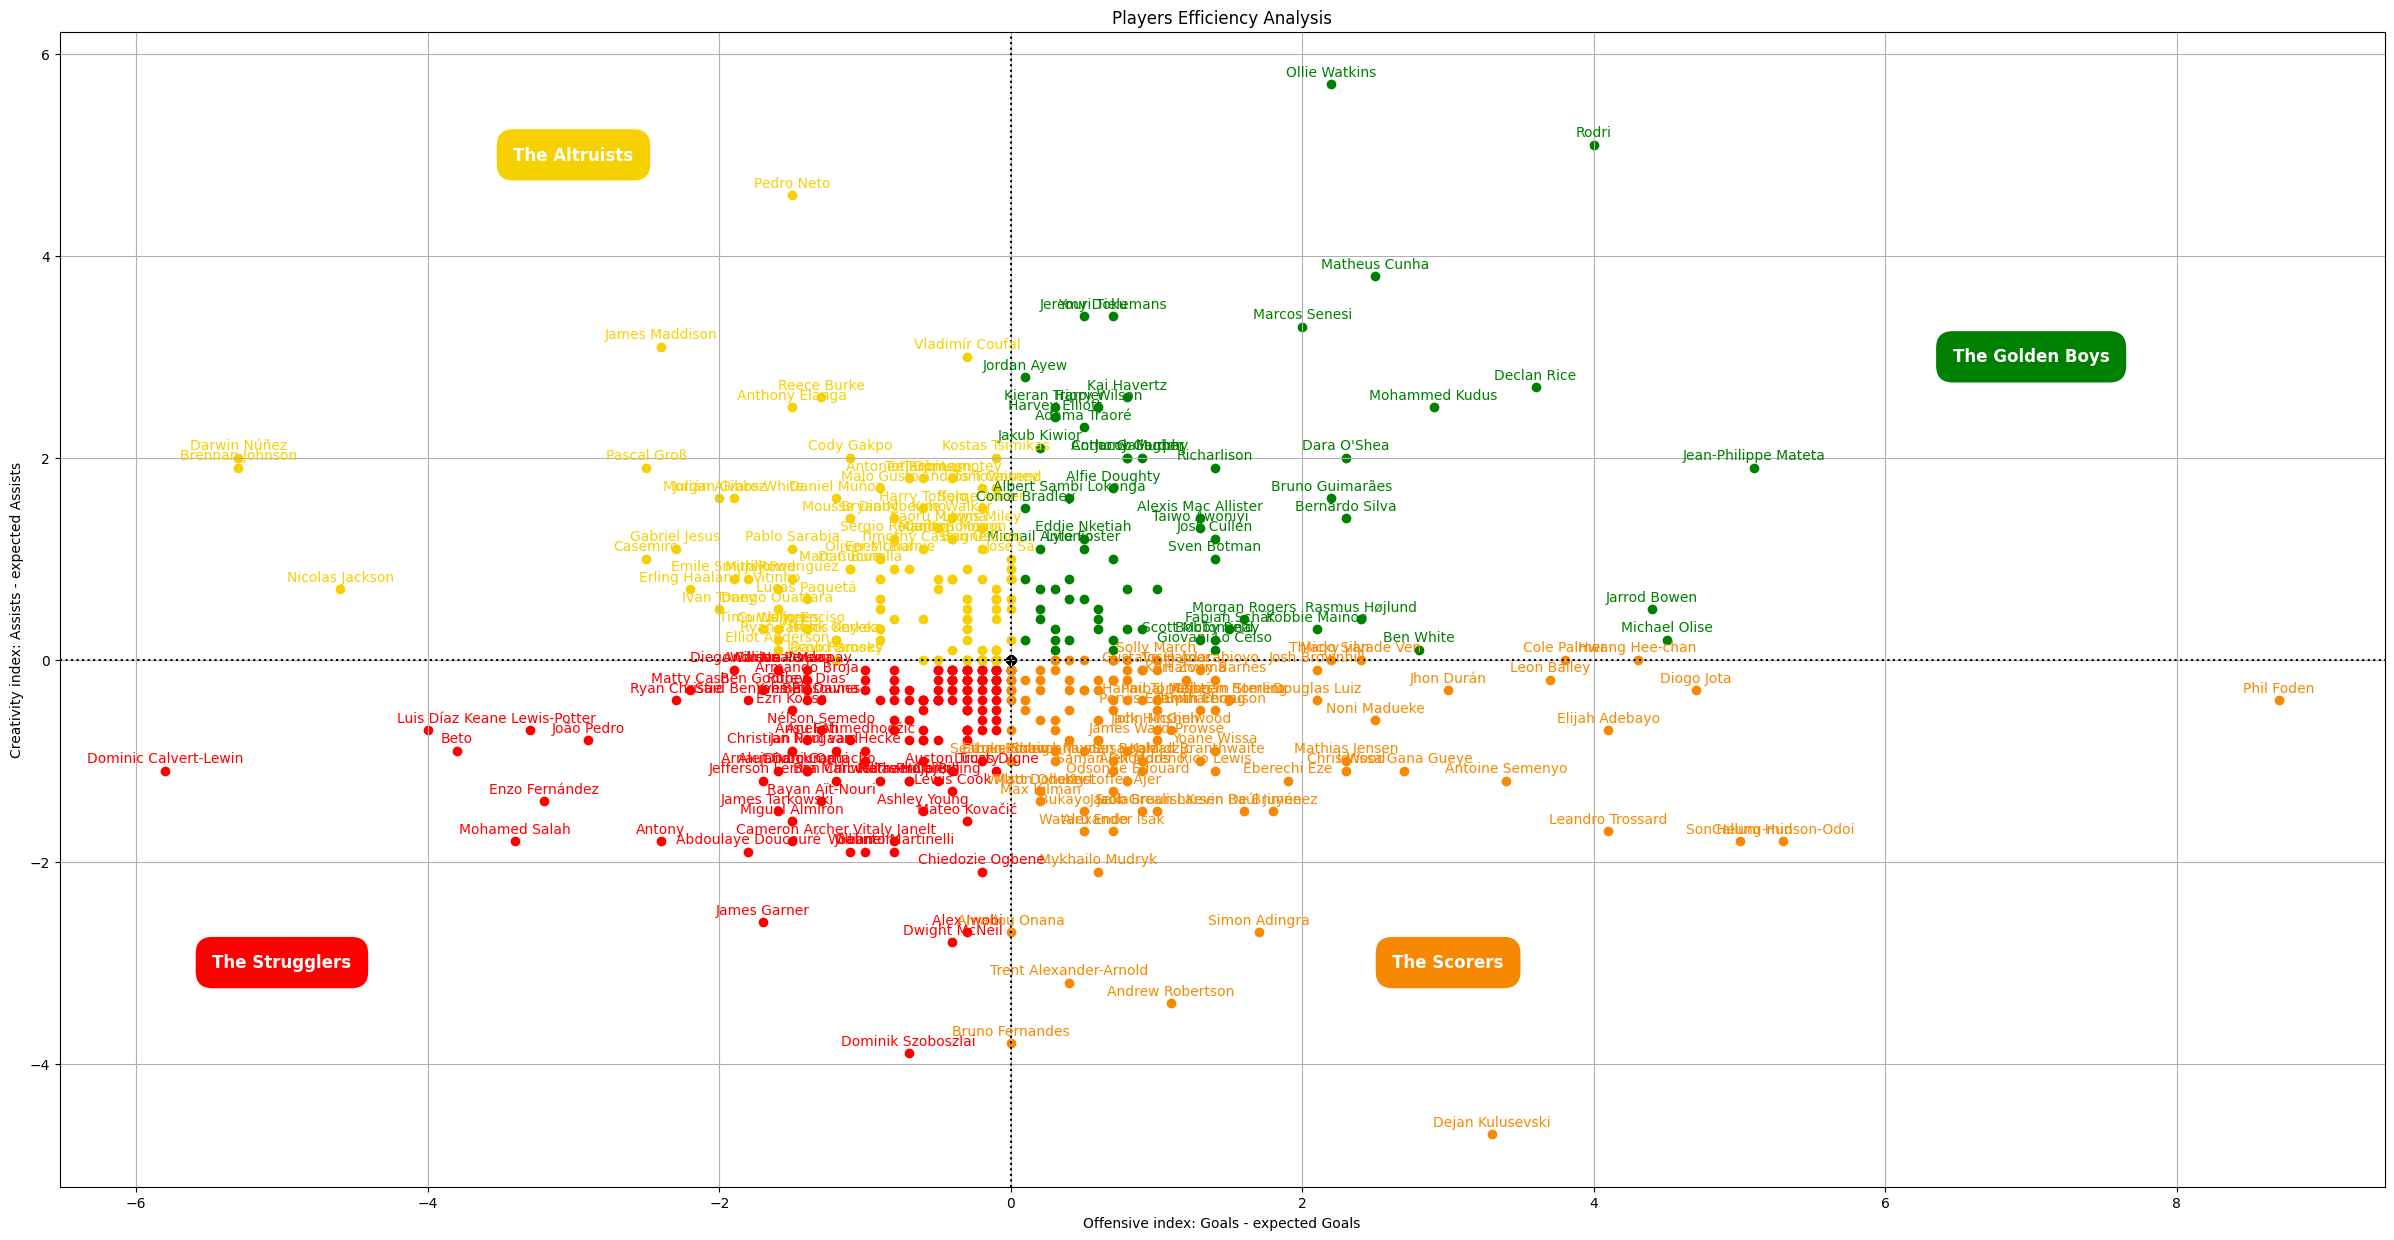
To make it easier to read the results, I've divided my graph into 4 categories:
- The Golden Boys, who are the most efficient players in terms of goals and assists.
- We can highlight some players who made a tremendous season for their team: Rodri, Declan Rice or Ollie Watkins.
- The Scorers, who are more efficient in terms of goals scored, but less efficient than expected in terms of assists.
- We can highlight some players who made a huge difference for scoring for their team: Phil Foden, Heug-min Son or Cole Palmer.
- The Altruists, who are more efficient in terms of assists, but less efficient than expected in terms of goals scored.
- We can highlight some players who were decisive for their teammates and for their team: Pedro Neto, James Maddison or Pascal Groß.
- Finally, the Struglers, who are less effective than expected in terms of goals scored and assists.
- We can highlight some players who were lacking effectiveness and should have been more decisive for their team: Enzo Fernández, Antony or Mohamed Salah.
Goalkeepers 🧤
Most saves per game played
For all the goalkeepers who played 5 matches at least, let's see who has the best saves per game played ratio:
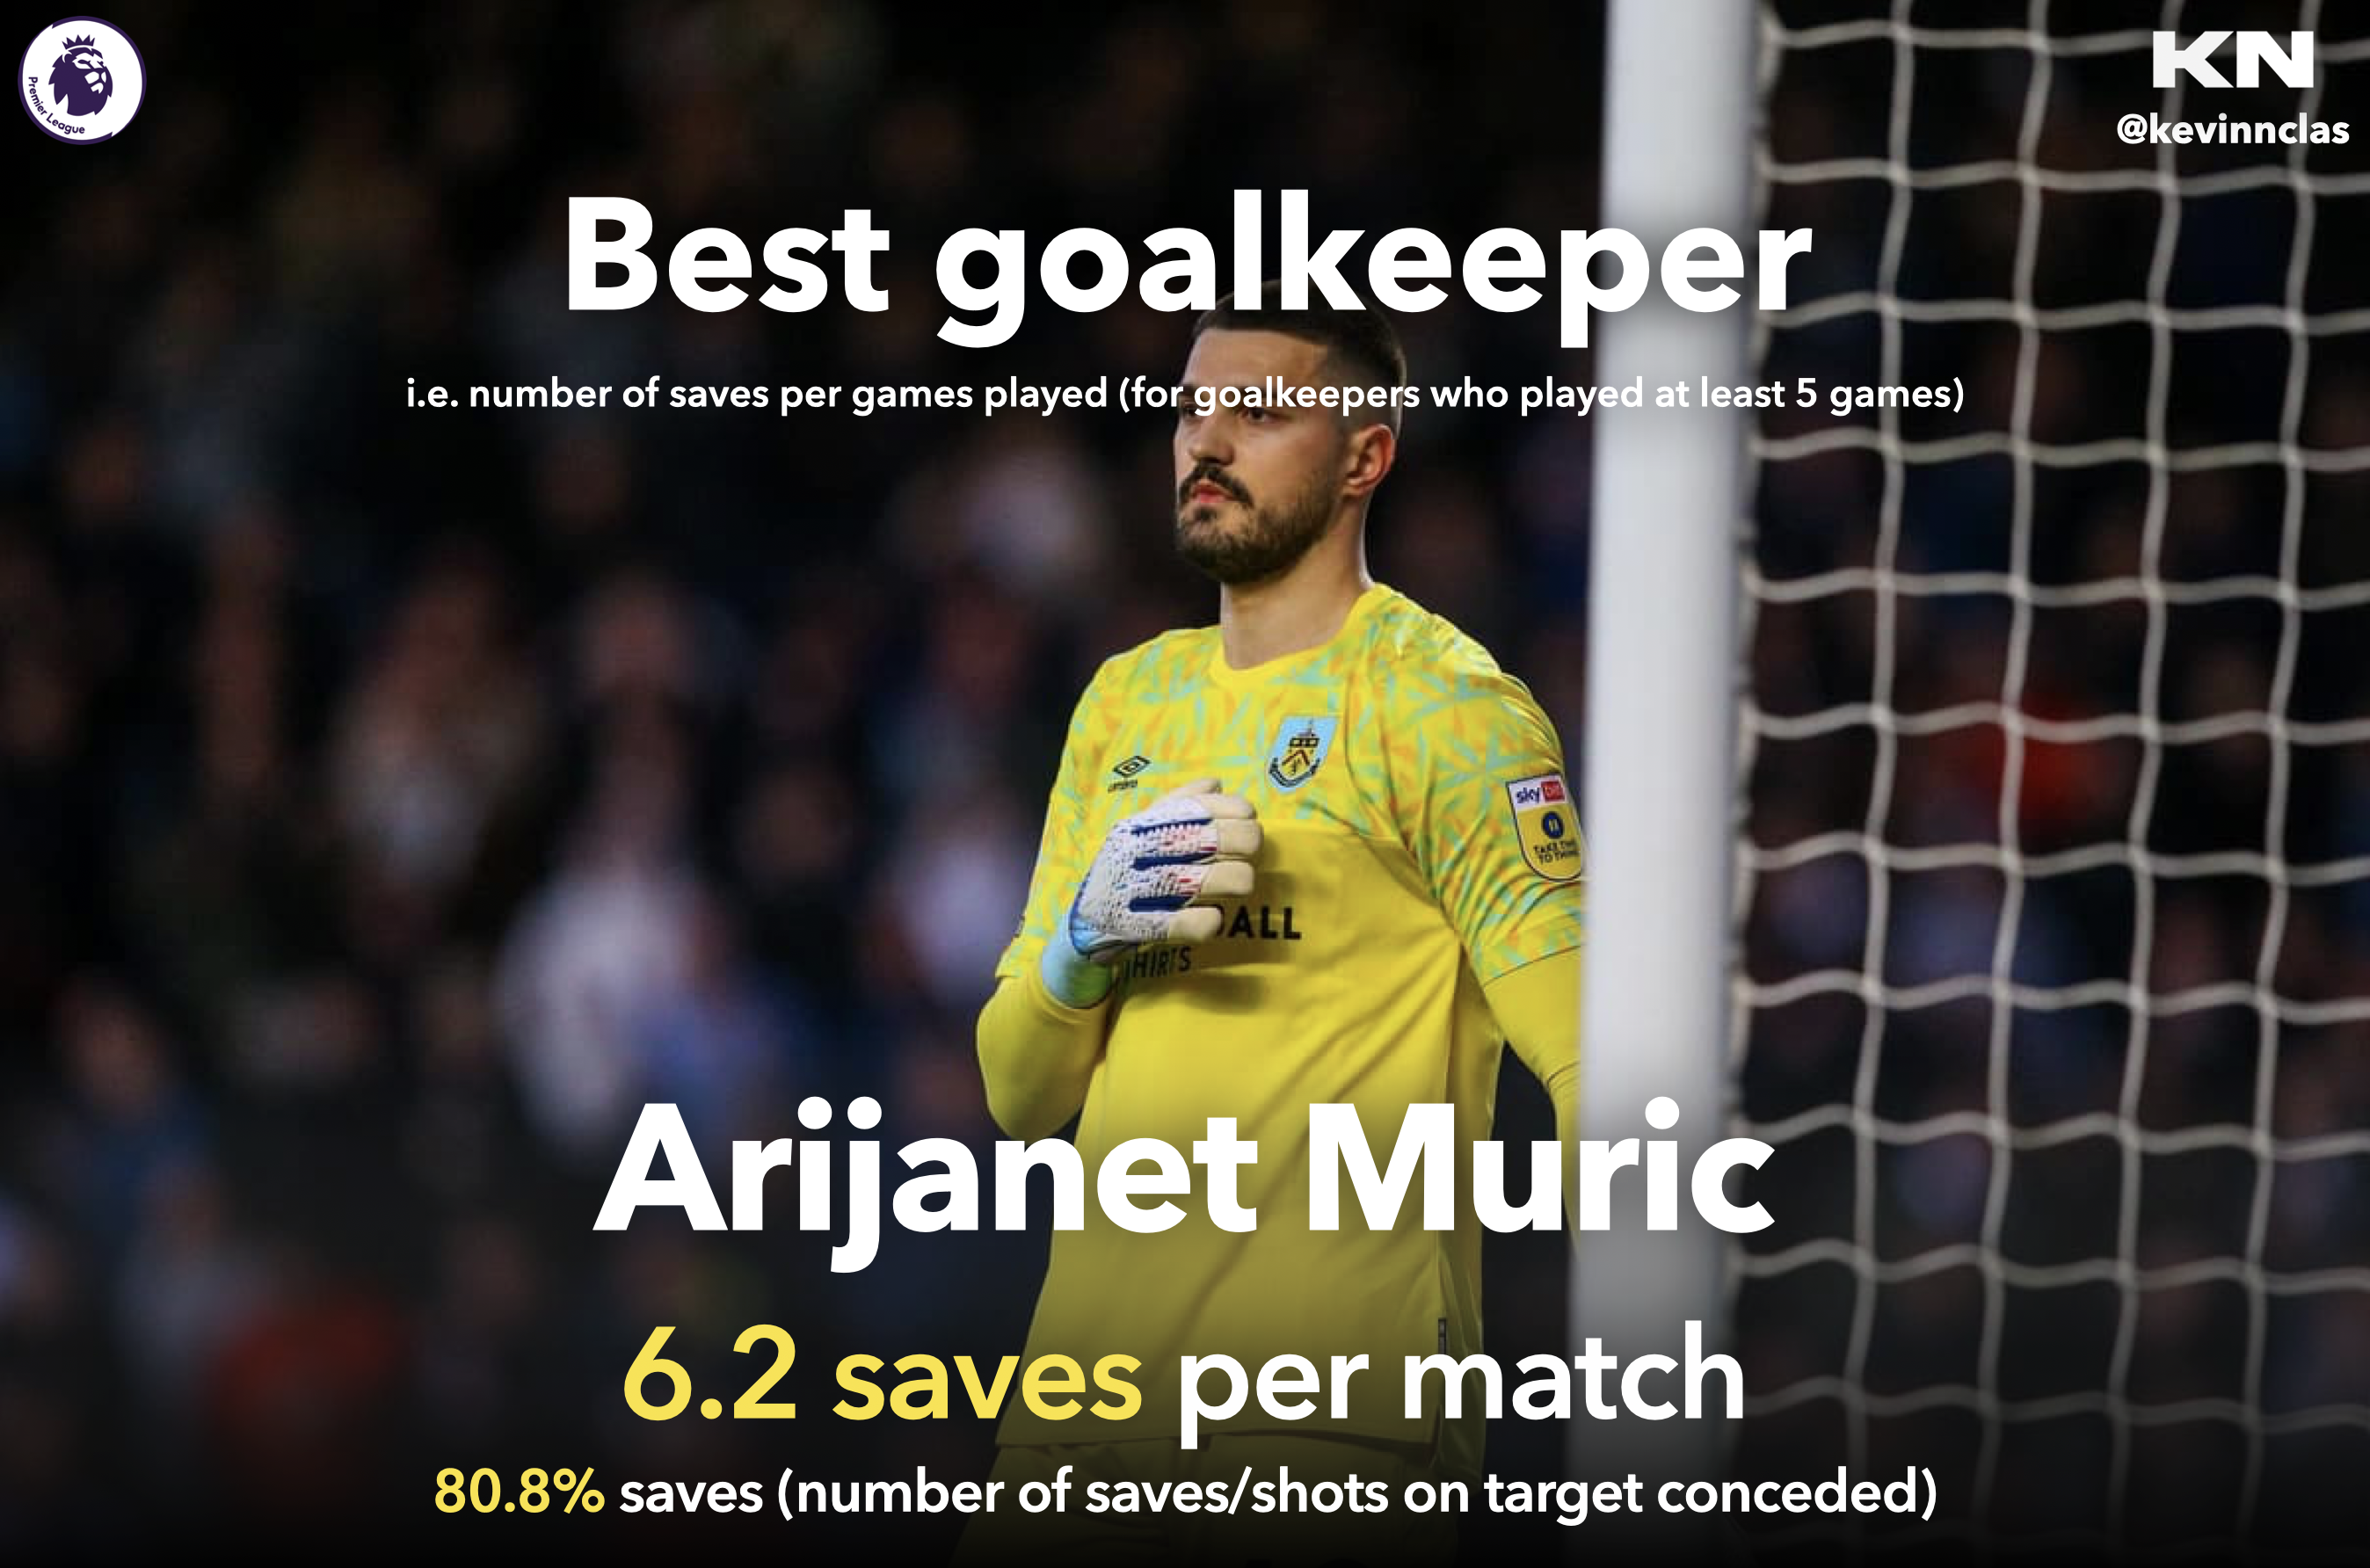
The best goalkeeper in terms of saves per match played is Arijanet Muric, with 62 saves for 10 games played.
Also, he has the best saves percentage ([shots on target against - goals against]/shots on target against) in the league, with 80.8% of saves.
Logically, the top goalkeepers of this criteria are from teams that conceded a lot of goals, like Sheffield Utd, Luton Town or Burnley.
On the other hand, the 3 last goalkeepers are from the 2 best teams in the league, i.e. Arsenal and Manchester City.
Goalkeeping efficiency
For each goalkeeper, I calculated the difference between the total number of goals scored against and the sum of the expected goals (PSxG) of the goals they conceded.
This determined the goalkeeping efficiency indicator for all the goalkeepers who played 5 matches at least, so let's see which goalkeeper was the most efficient:
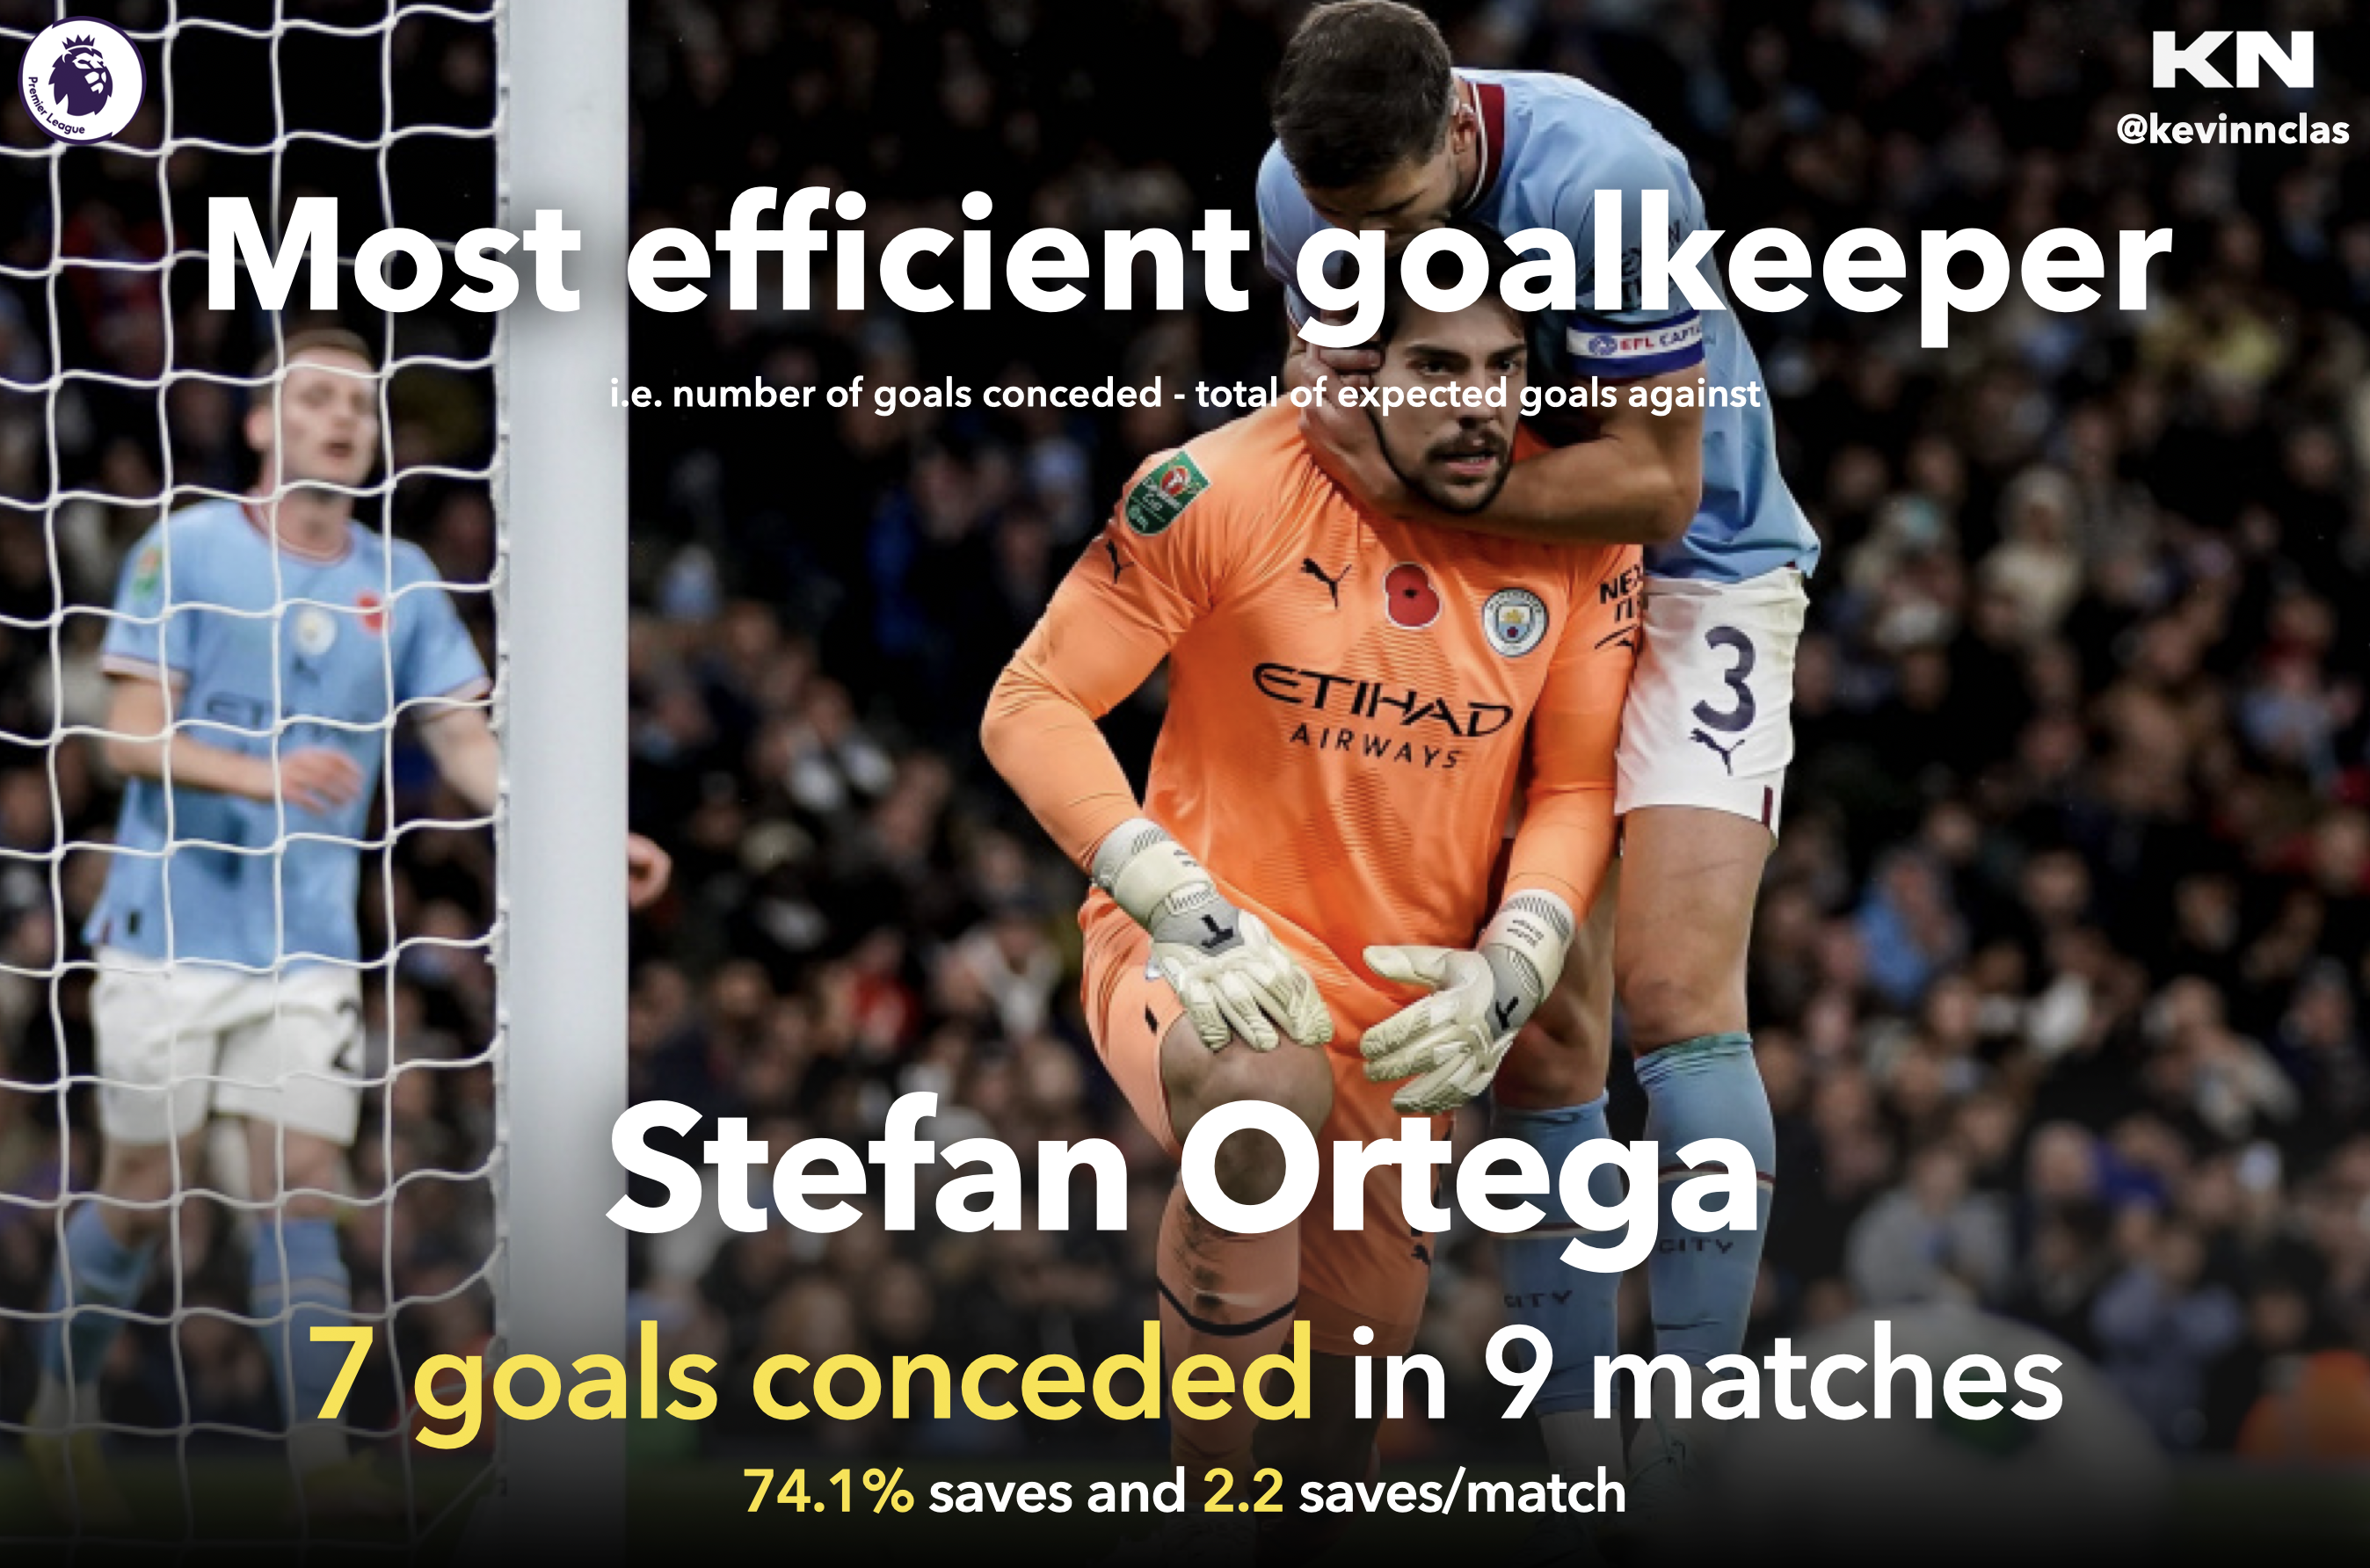
With 9 matches played, the best goalkeeper in terms of efficiency is Stefan Ortega, with an efficiency indicator of 2.59.
Not surprising to see the Citizen goalkeeper at the top of this ranking, because of the great season of Manchester City.
Player who dribbles the most ⛹️
Let's highlight who is the best dribbler in the Premier League now!
💡 The indicator measures the number of carries that move the ball towards the opponent's goal line at least 10 yards from its furthest point in the last six passes, or any carry into the penalty area. It excludes carries which end in the defending 50% of the pitch.

With 218 progressive carries in 29 matches (1595 minutes) played, the player who dribbles the most is Jeremy Doku, who plays for Manchester City.
The Belgian who just arrived this season at City is already showing himself in the League, by being one of the most percutive player and a real threat for opponent's defense.
Player who makes the most progressive passes 🏌️♂️
Now let's see who was the passer who most advanced his team's play:
💡 The indicator measures the number of completed passes that move the ball towards the opponent's goal line at least 10 yards from its furthest point in the last six passes, or any completed pass into the penalty area. It excludes passes from the defending 40% of the pitch.
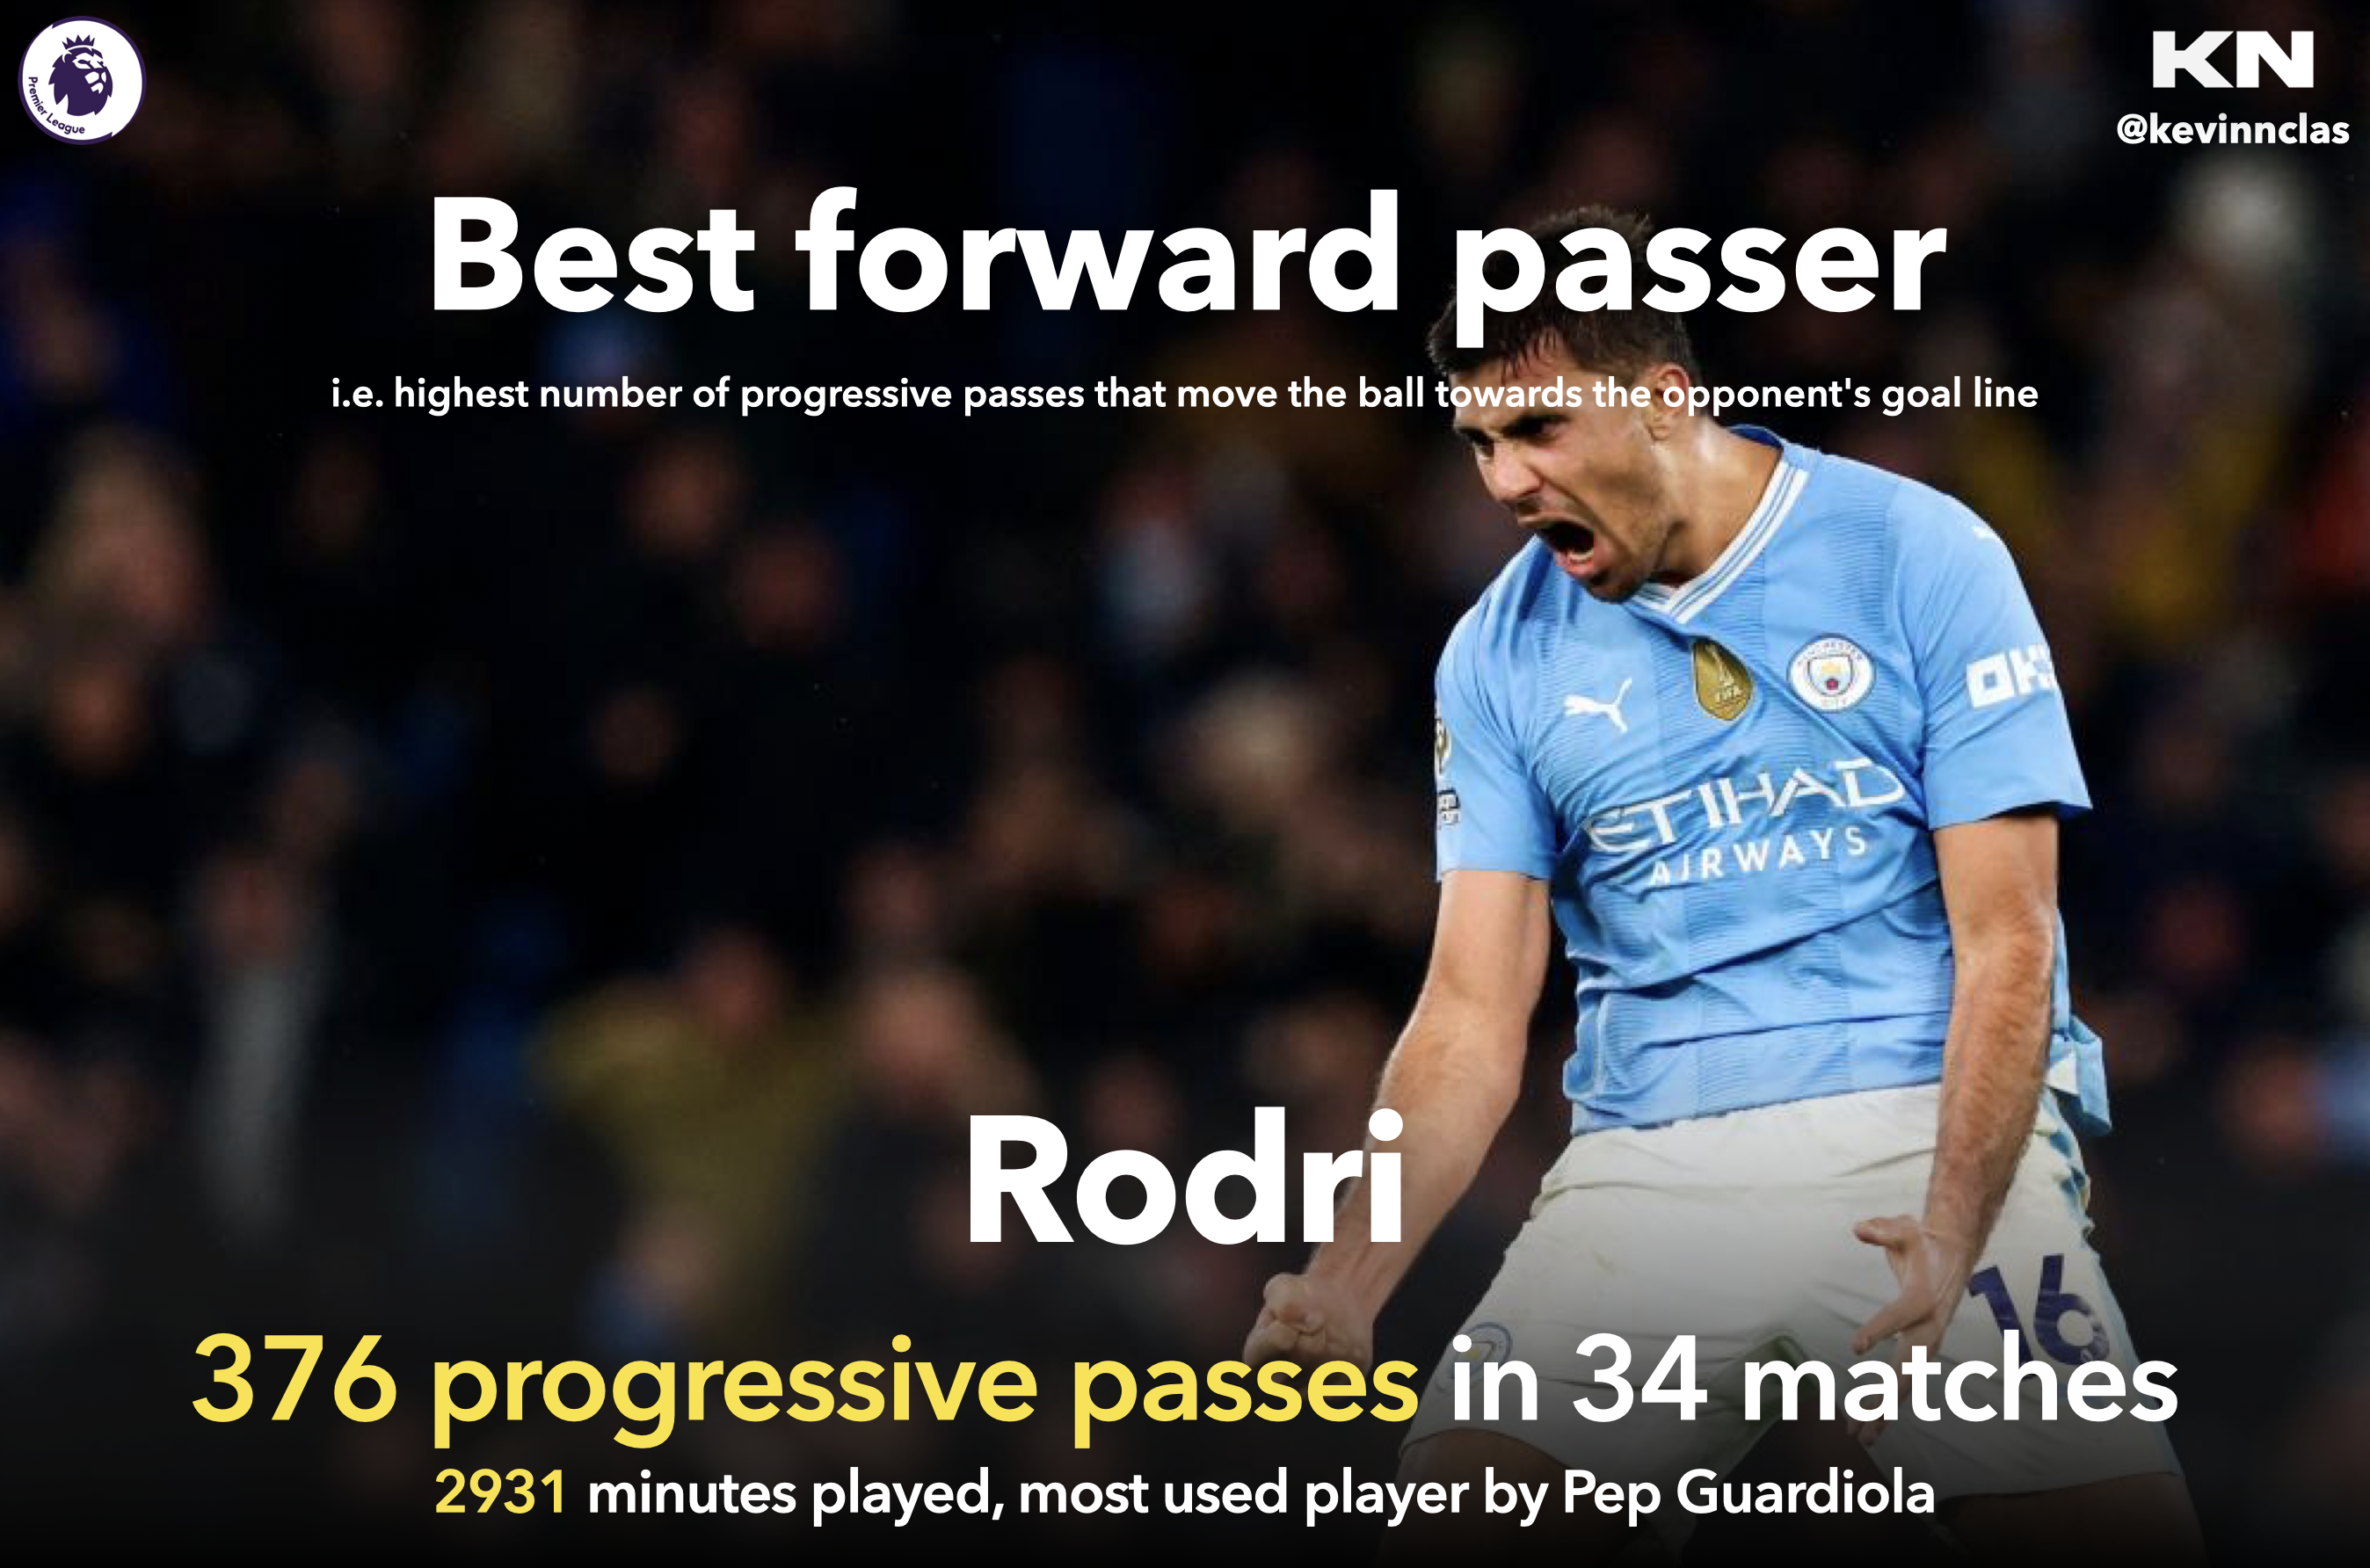
With 376 progressive passes in 34 matches (2931 minutes) played, the player who delivered the most progressive passes is Rodri, who also plays for Manchester City.
Being one of the player who was used the most by Pep Guardiola, we know understand why, regarding the importance of this player in City's midfield!
Player who creates the most spaces to receive progressive passes 🏃♂️➡️
Movement to receive great passes is very important in football. Let's see which player created the most spaces to receive progressive passes:
💡 The indicator measures the number of received completed passes that move the ball towards the opponent's goal line at least 10 yards from its furthest point in the last six passes, or any completed pass into the penalty area. It excludes passes from the defending 40% of the pitch.

With 508 progressive passes received in 35 matches (2919 minutes) played, the player who created the most spaces for passes is Bukayo Saka, who plays for Arsenal.
He was one of the major player for the Gunners this season, and it's not surprising to see him at this position.
We saw that the best players of the league were either from Arsenal or Manchester City, what a battle for the title!
Teams
Now, we will focus on teams who have impacted this 2023-2024 Season and on others who haven't, based on their sportive performances.
Goals Analysis ⚽️
Pitch location
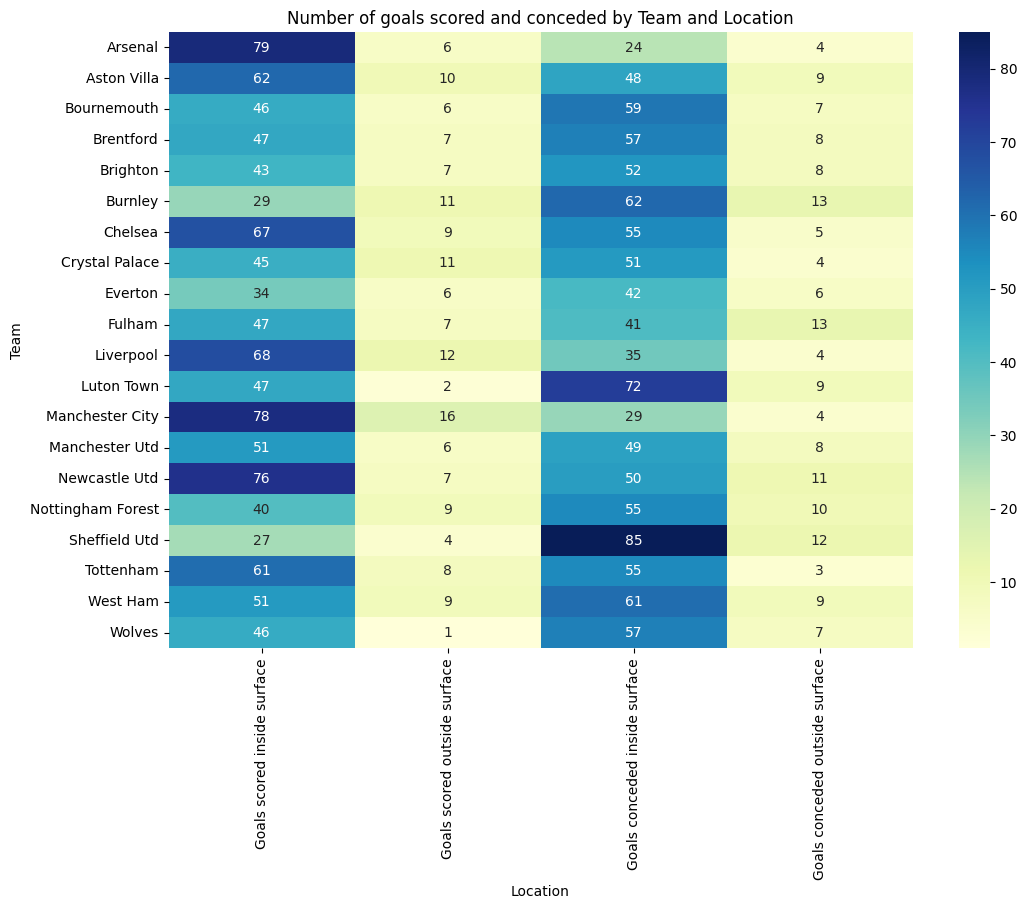
Let's take a look at the distribution of the distance between goals scored and conceded, i.e. the number of goals scored and conceded outside and inside the box:
A quick summary on this graph:
-
The teams that scored the most in the surface:
- Arsenal - 79 goals
- Manchester City - 78 goals
- Newcastle Utd - 76 goals
-
The teams that scored the most out the surface:
- Manchester City - 16 goals
- Liverpool - 12 goals
- Burnley and Crystal Palace - 11 goals
-
The teams that conceded the most in the surface:
- Sheffield Utd - 85 goals
- Luton Town - 72 goals
- Burnley - 62 goals
-
The teams that conceded the most out the surface:
- Burnley and Fulham - 13 goals
- Sheffield Utd - 12 goals
- Newcastle Utd - 11 goals
Action type
Let's take a look at the distribution of the type of goals scored and conceded by each team, i.e. the number of goals scored and conceded depending the goal's motion:
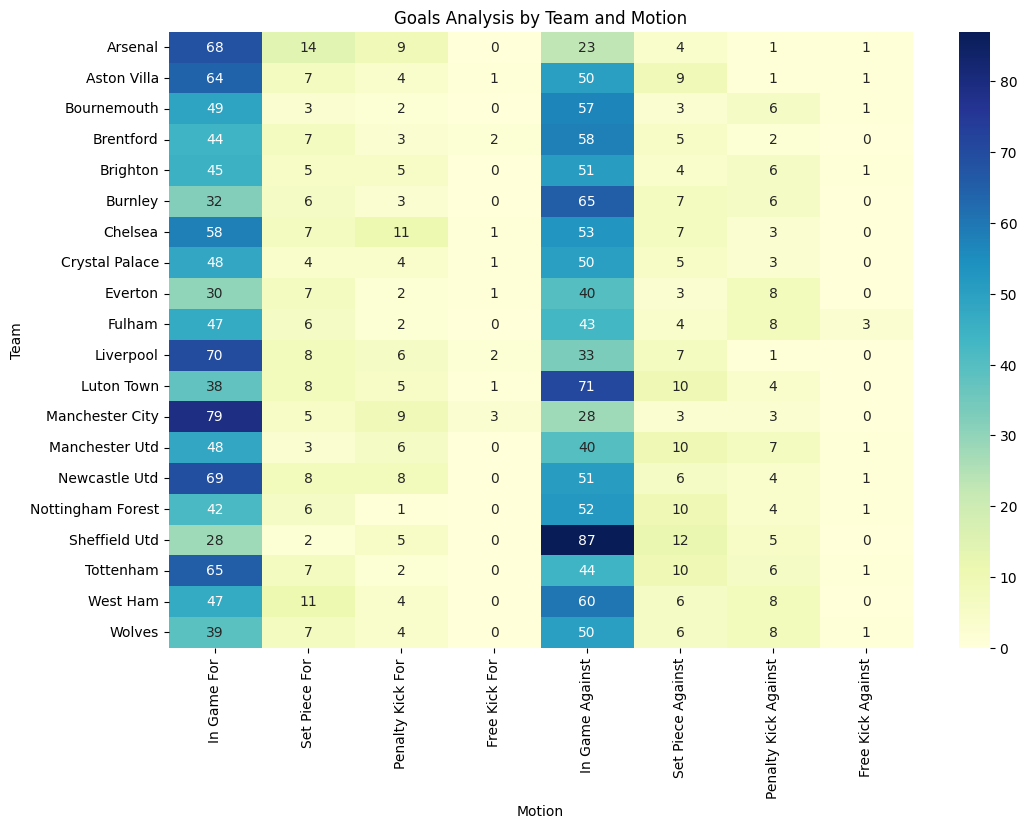
A quick summary on this graph:
-
For in game goals:
- The team who scored the most is Manchester City with 79 goals
- The team who conceded the most is Sheffield Utd with 87 goals
-
For set piece goals:
- The team who scored the most is Arsenal with 14 goals
- The team who conceded the most is Sheffield Utd with 12 goals
-
For penalty kick goals:
- The team who scored the most is Chelsea with 11 goals
- The teams who conceded the most are Everton, Fulham, West Ham and Wolves with 8 goals
-
For free kick goals:
- The team who scored the most is Manchester City with 3 goals
- The team who conceded the most is Fulham with 3 goals
Body part
Now, let's take a look at the distribution of the body part with which goals were scored and conceded by each team:
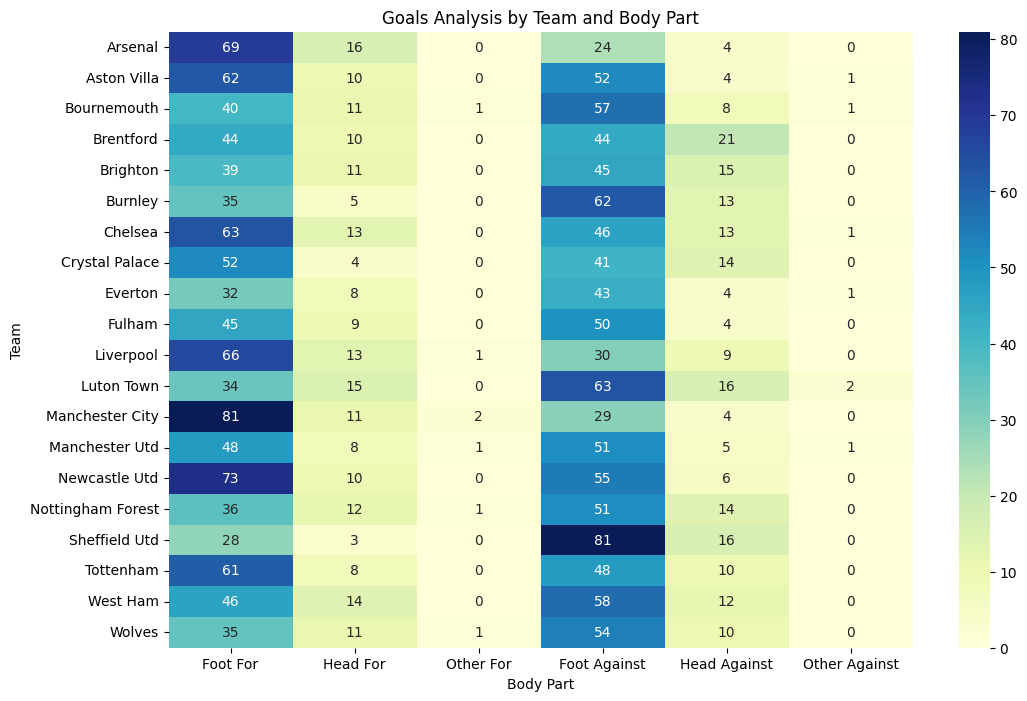
A quick summary on this graph:
-
For goals scored with foot:
- The team who scored the most is Manchester City with 81 goals
- The team who conceded the most is Sheffield Utd with 81 goals
-
For goals scored with head:
- The team who scored the most is Arsenal with 16 goals
- The team who conceded the most is Brentford with 21 goals
Home & away
Finally, let's take a look at the distribution of the goals scored, at home or away, by each team:
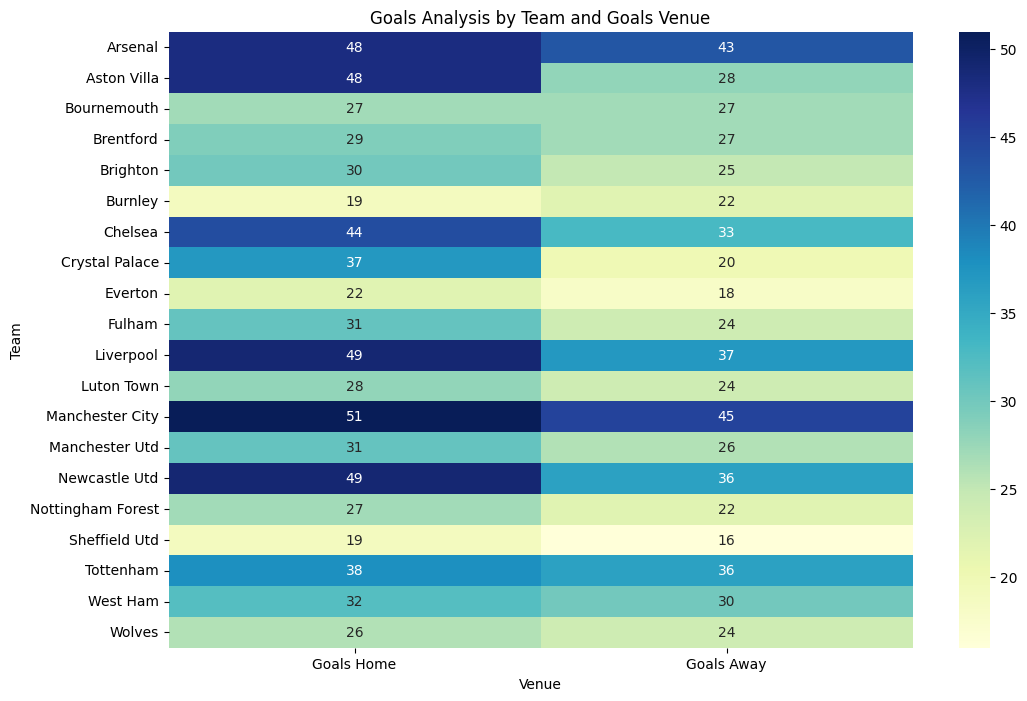
The team who scored the most at home is Manchester City with 51 goals.
The team who scored the most away is also Manchester City with 45 goals, which is a huge performance, because it's almost as much as at home.
Best offense 🤾♂️
Which team scored the most goals this season? Let's find out:

With 96 goals scored, the best team offense in the league is Manchester City, with an average of 2.52 goals per match.
They are also the best attack playing at home with 51 goals, and away with 45 goals. The Citizens were just unplayable this season!
Best defense 🛡️
Now, let's see which team conceded the least goals this season:

With only 29 goals conceded, Arsenal are the best defense in the league. They only conceded 16 goals at home, and 13 away.
Results home/away 📊
Let's look the overview of the results of the teams this season, i.e. the number of wins, draws and loses for each team:
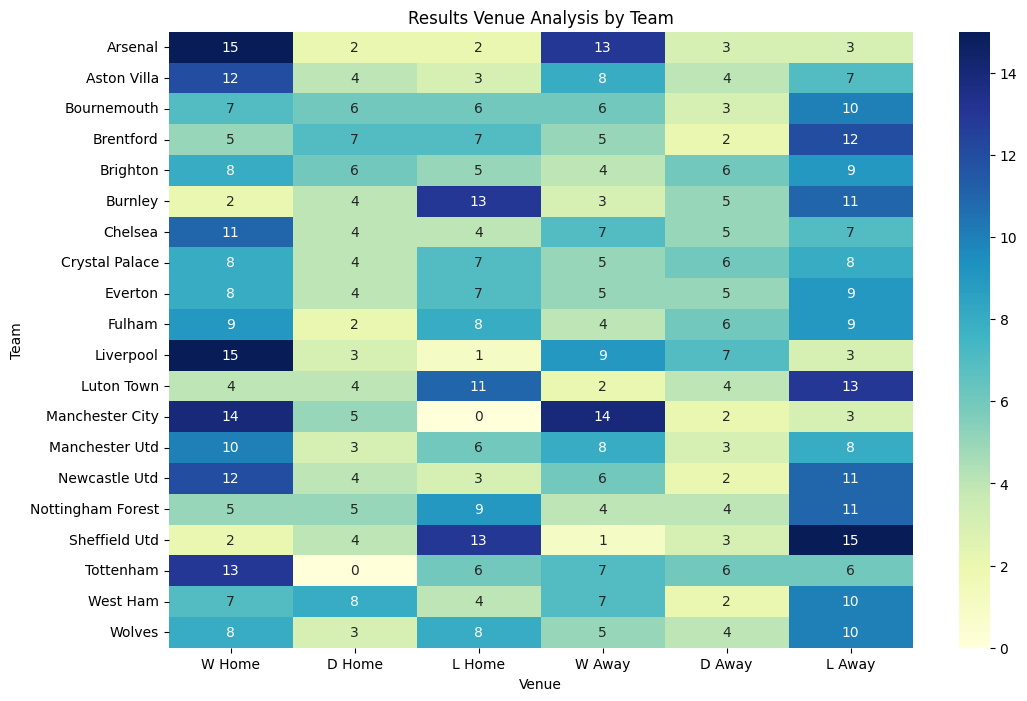
Let's have a quick summary on some teams:
- Manchester City never lost at home
- Tottenham never drawn at home
- Sheffield Utd only won once away
- Burnley won more away than at home, and lost more at home than away
Discipline 🟨🟥
Yellow cards
Let's find out which team received the most yellow cards:
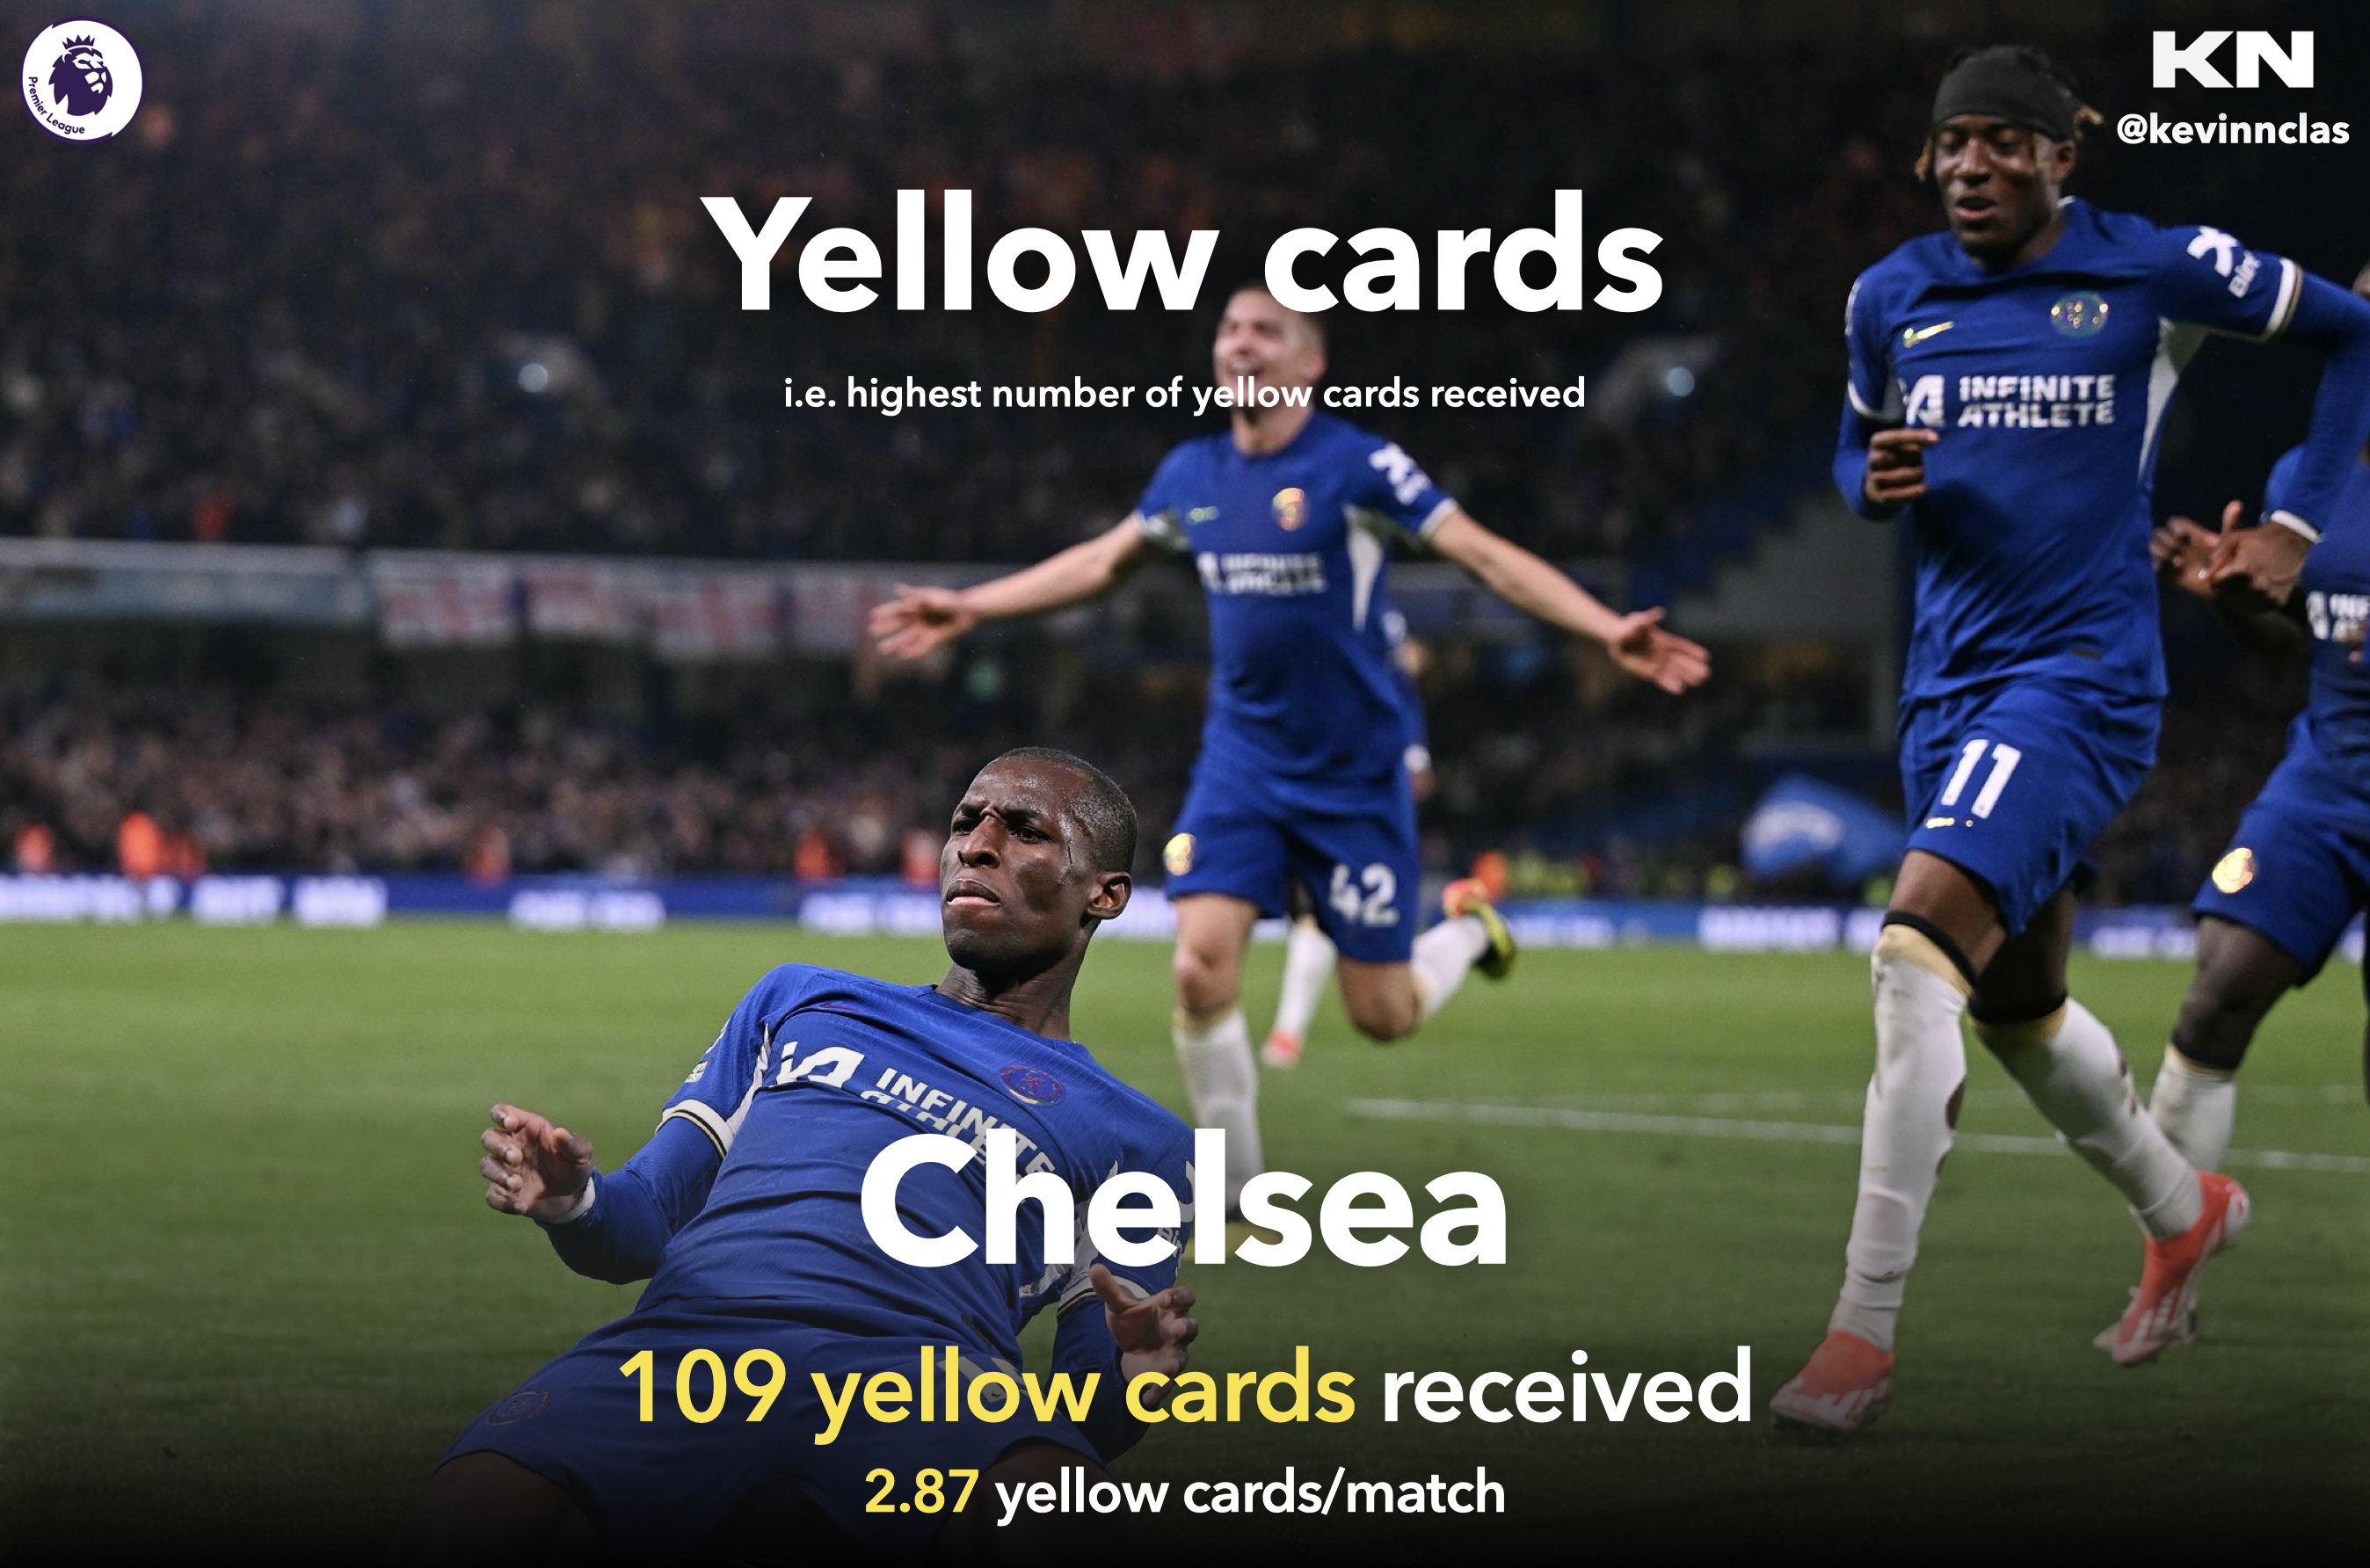
With 109 yellow cards, Chelsea received the most yellow cards this season with more than 2.87 yellow cards per game.
The team that received the least yellow cards is Manchester City with 53 yellow cards.
Red cards
Let's find out which team received the most red cards:
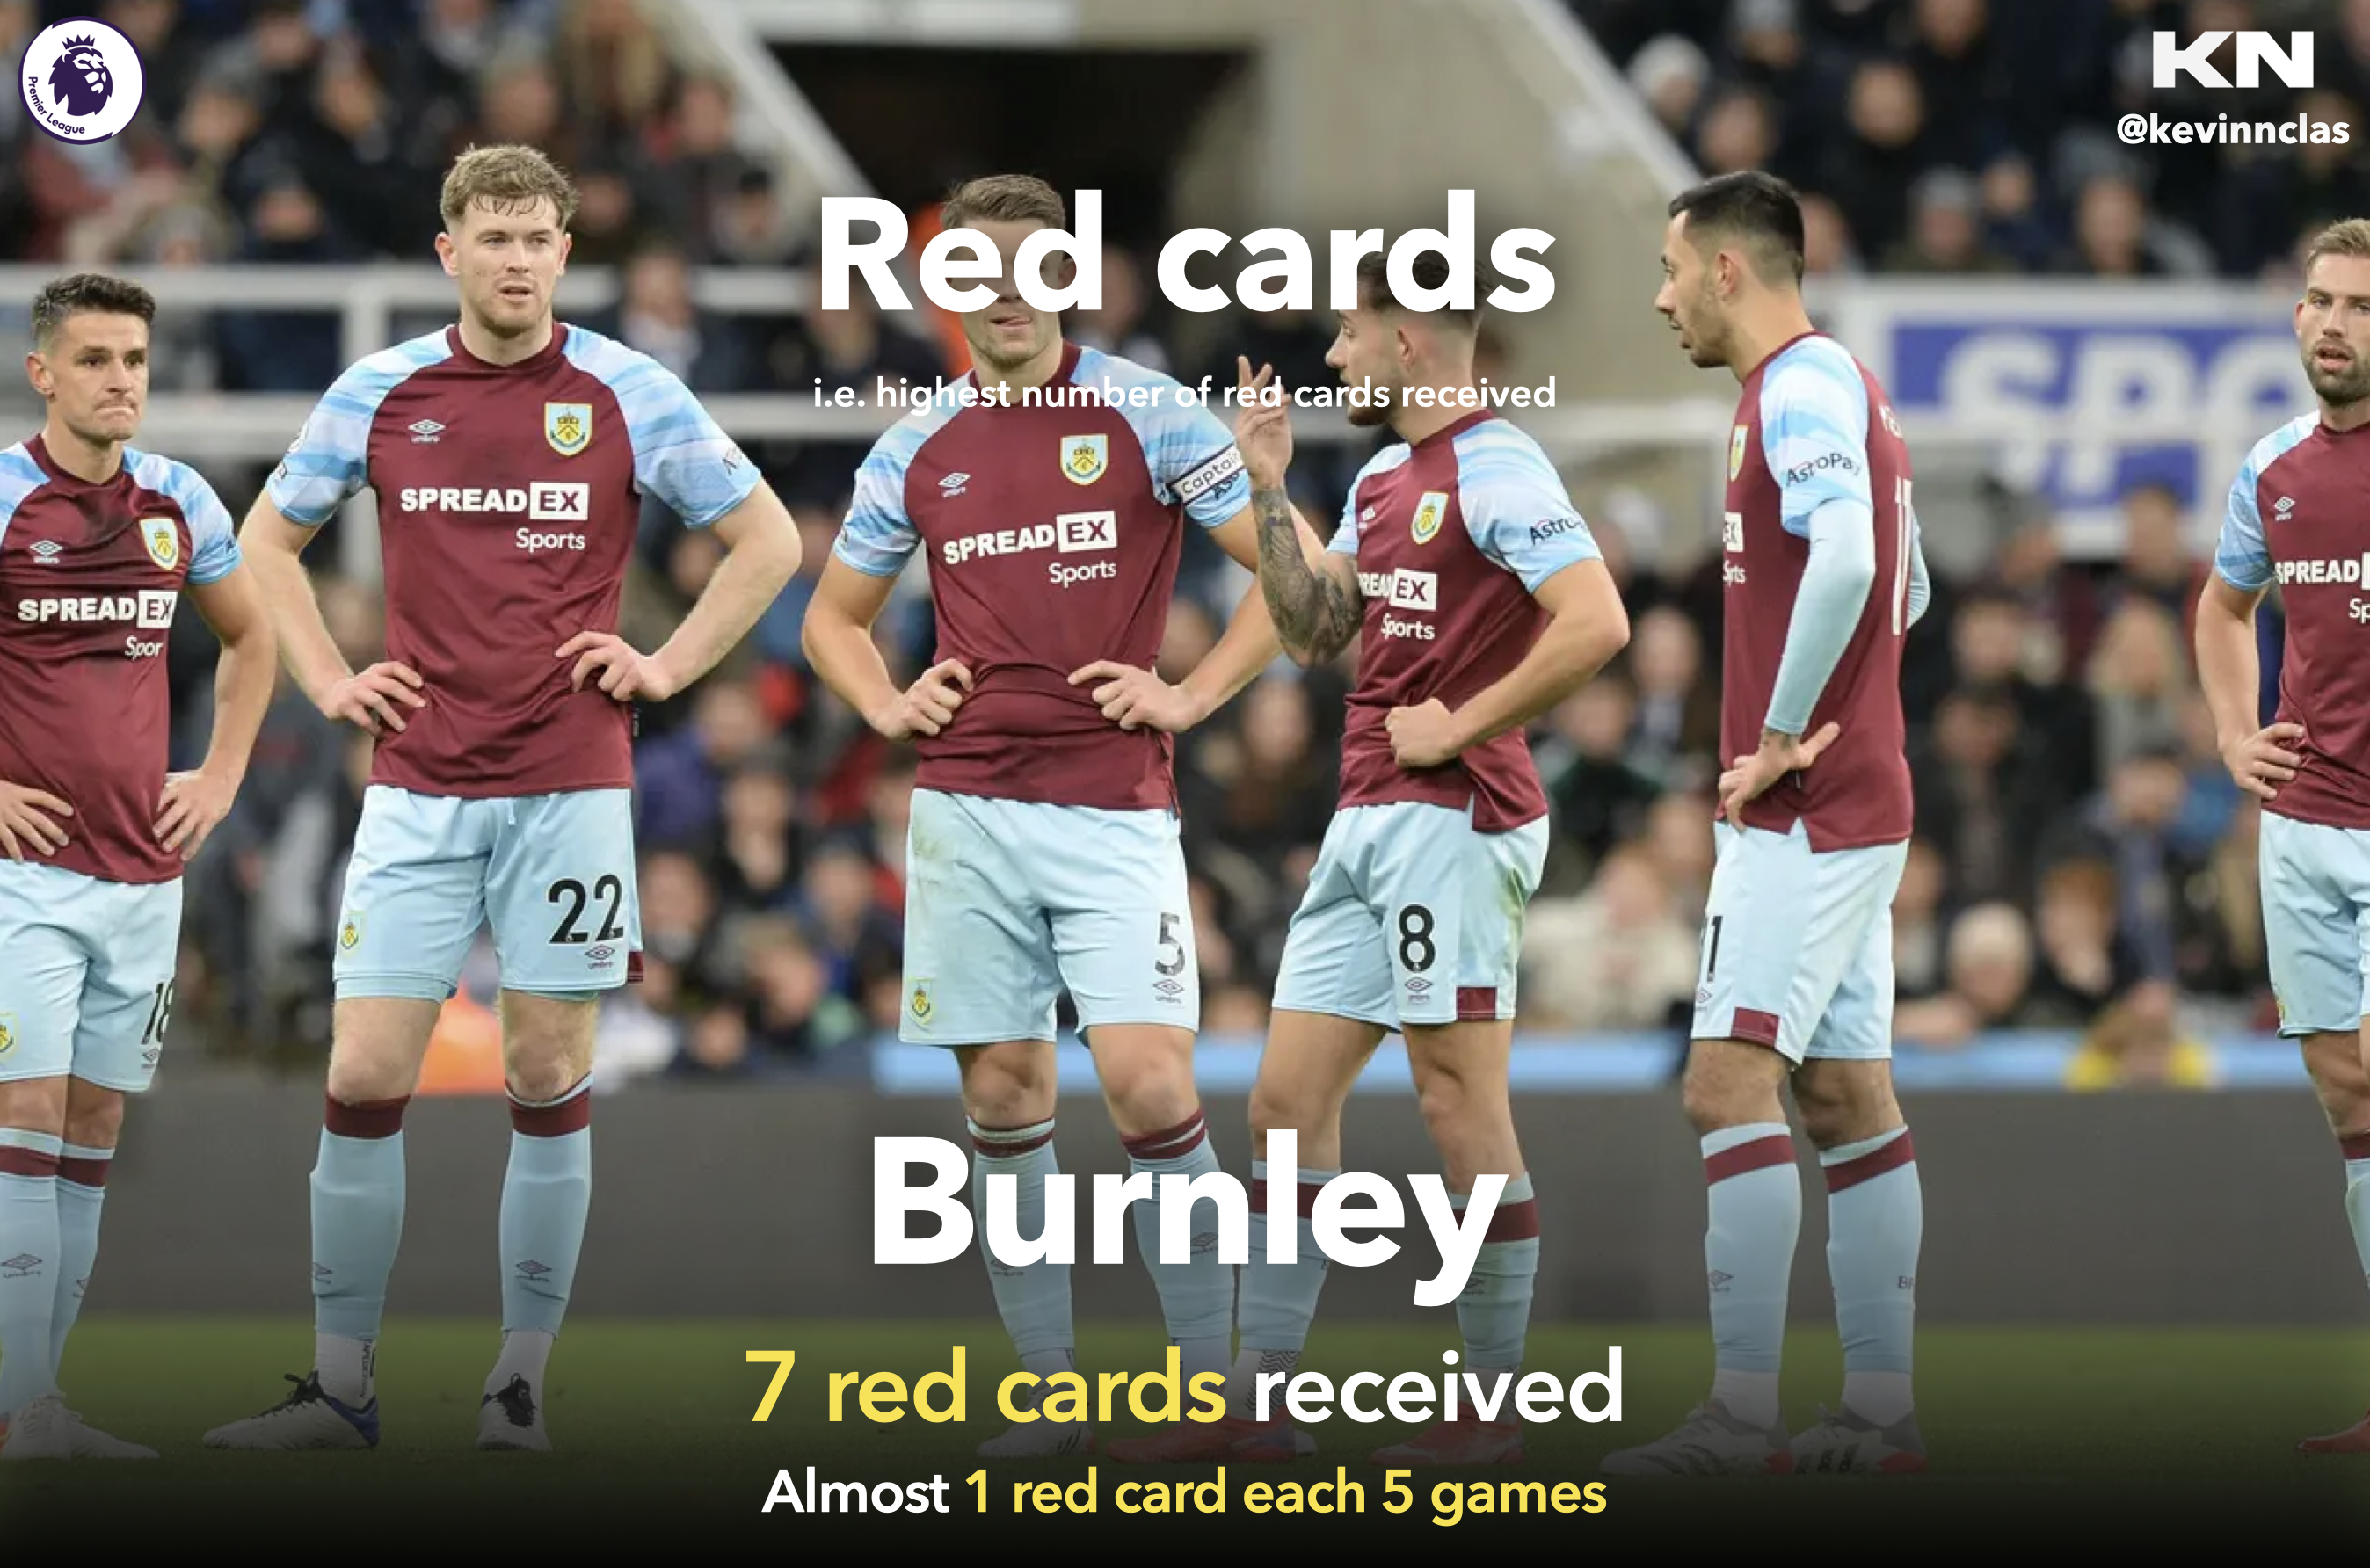
With 7 red cards, Burnley received the most red cards this season with almost 1 red card each 5 games.
Each team received a red card, except Luton Town. Also, it's the 4th team that received the least yellow cards, this team is very disciplined!
Aerial duels won 🛫
Let's see which team were the most dominating in aerial duels:

With 56,9% of aerial duels won, Liverpool was the most dominating team on aerial duels.
Correlation between goals scored and points won 📈
I wanted to see if there were any correlation between the number of goals scored and the points won by every team. Let's look at the results:
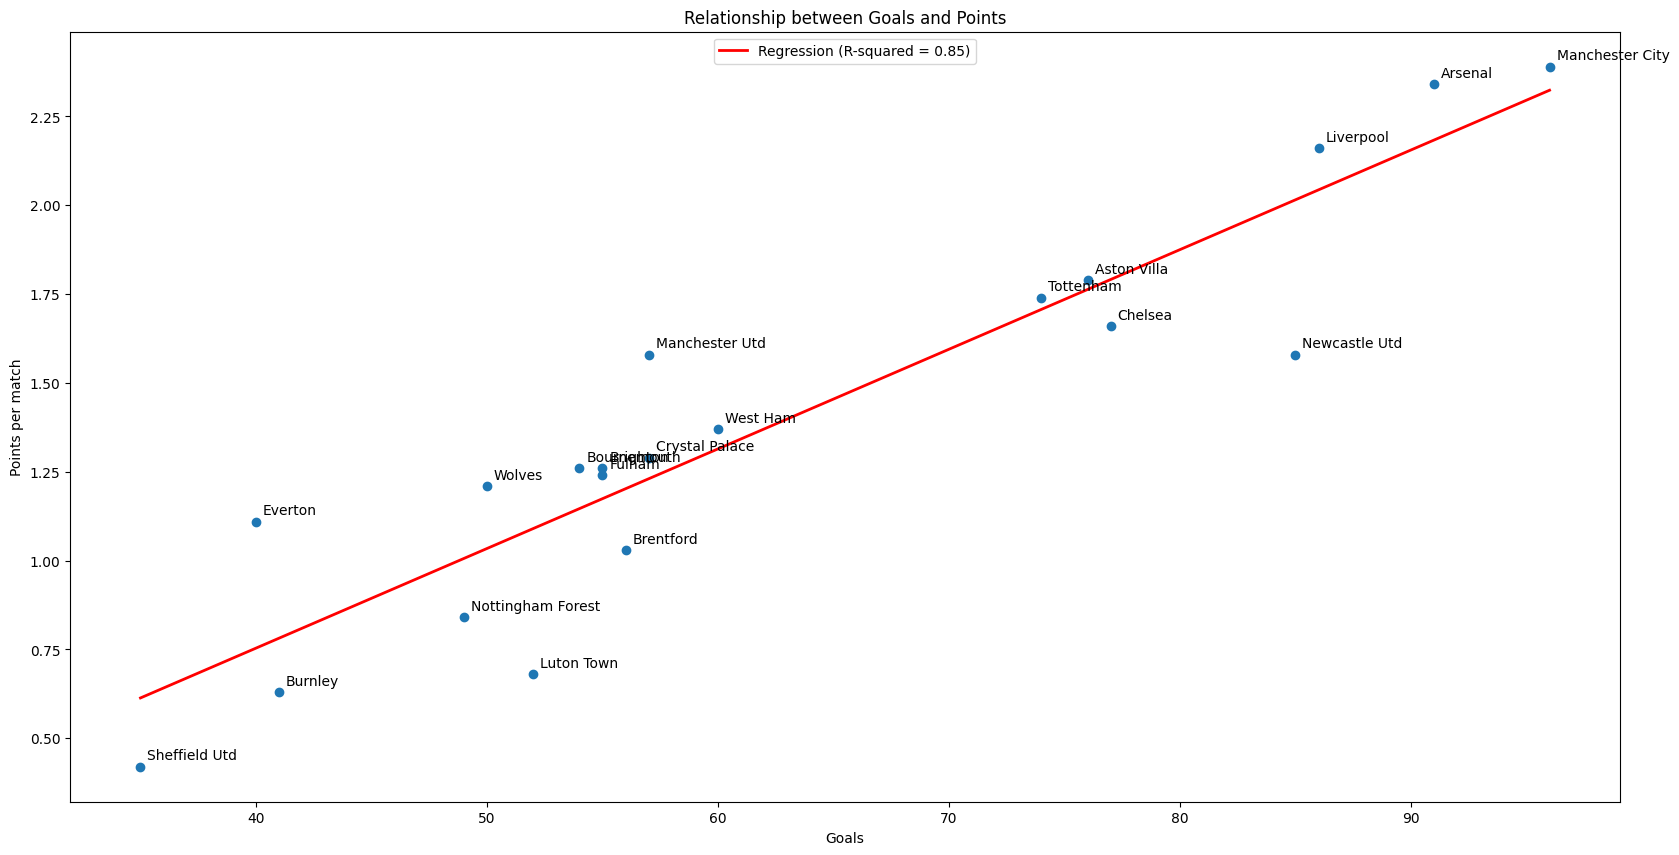
The coefficient of determination (R-squared) is equal to 0,85: this means that 85% of the variation in points per match can be explained by the number of goals scored.
We can analysis this graph based on those two metrics:
- Manchester City, Arsenal and Liverpool are logically at the top right of this graph, and are therefore very performant in terms of points per match, scoring also a lot of goals.
- Tottenham and Aston Villa obtained more points than their number of goals scored would suggest. They are therefore more efficient in terms of points obtained per goal scored.
- Chelsea and Newcastle Utd scored fewer points than their number of goals scored would suggest. They are therefore less efficient in terms of points obtained per goal scored.
- Everton and Manchester Utd, despite scoring relatively few goals, picked up slightly more points than expected compared to the general trend.
Effectiveness 🚦
As we have already done for the players, we will now look at teams efficiency.
To measure it, this is how I did it:
- I've chosen to calculate this indicator according to two criteria: the first is offensive efficiency, which is the difference between the number of goals scored and the number of expected goals.
- Thus, a team with a positive result scores more often than expected.
- The other criterion concerns defensive efficiency. This is done in the same way as the other criterion, by taking the difference between the number of goals conceded and the number of expected goals conceded.
- Thus, a team with a negative result concede less goals than expected.
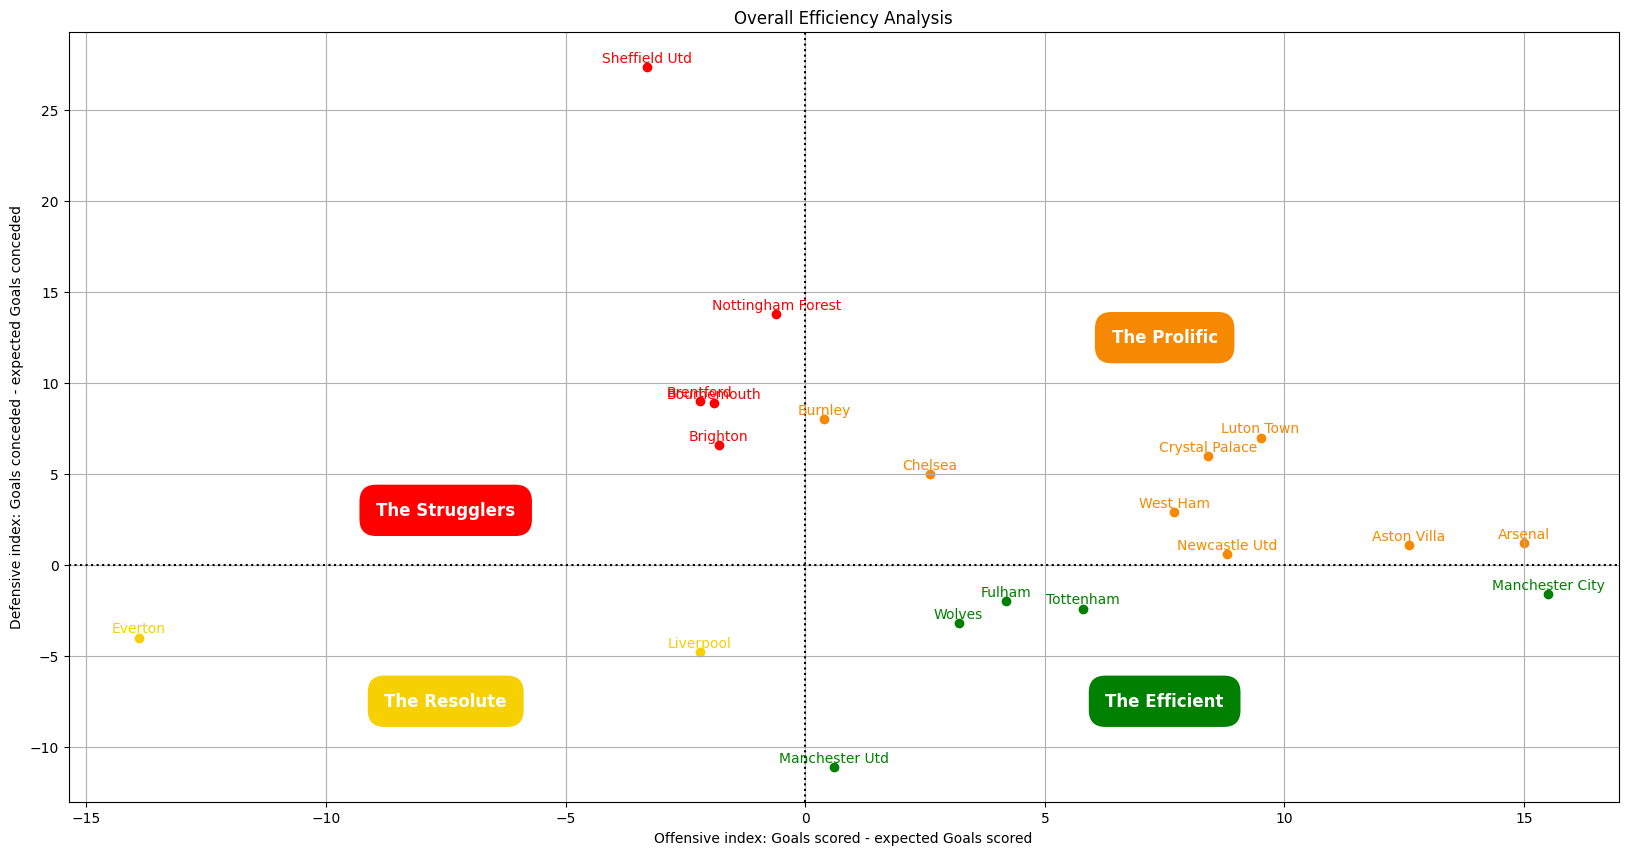
Let's see the results in 4 categories:
- The Efficient, who are the most efficient teams in terms of goals scored and not conceded.
- We can highlight some teams who made a great season: Fulham, Tottenham or Manchester City of course.
- The Prolific, who are more efficient in terms of goals scored, but less efficient than expected in terms of goals conceded.
- We can highlight some teams who were good for scoring, but less for defending: West Ham, Crystal Palace or Arsenal.
- The Resolute, who are more efficient in terms of goals not conceded, but less efficient than expected in terms of goals scored.
- We can highlight some teams who were good for defending, but less for scoring: Liverpool and Everton.
- Finally, the Struglers, who are less effective than expected in terms of goals scored and conceded.
- We can highlight some of the teams that lacked effectiveness and were a little disappointing: Sheffield Utd, Brentford or Nottingham Forest.
Effectiveness at home
It is interesting to see the same graph but for teams playing at home, as some teams were more effective at home than away:
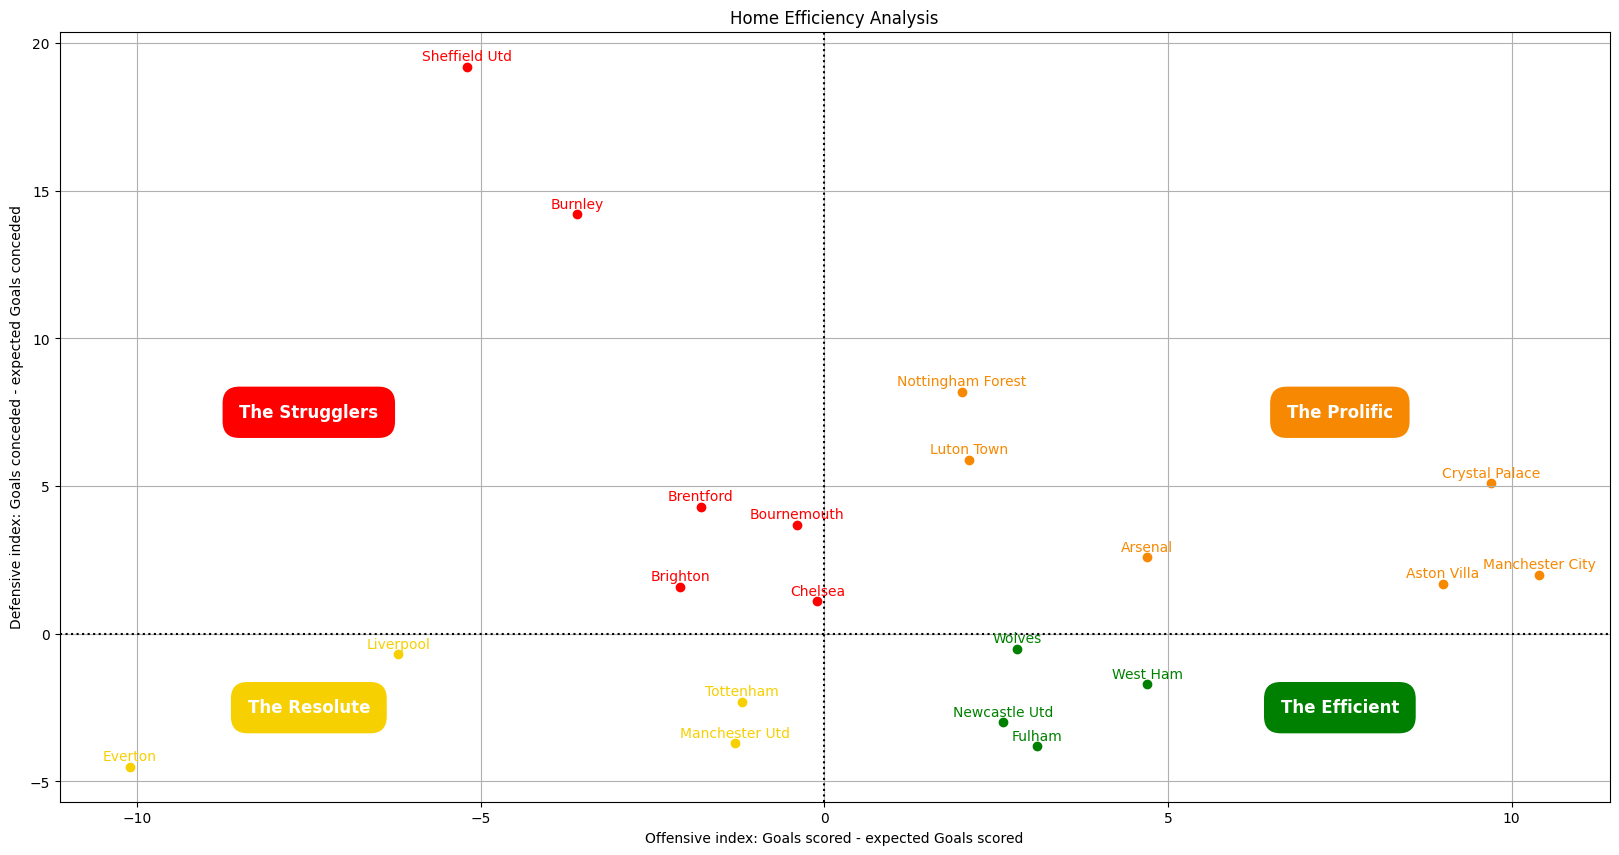
As you can see, Newcastle Utd or West Ham now are in the Efficient category, where Manchester City and Nottingham Forest are now in the Prolific category.
Effectiveness away
As for home, let's now look at the same graph but for teams playing away, because some teams were more effective away than at home:
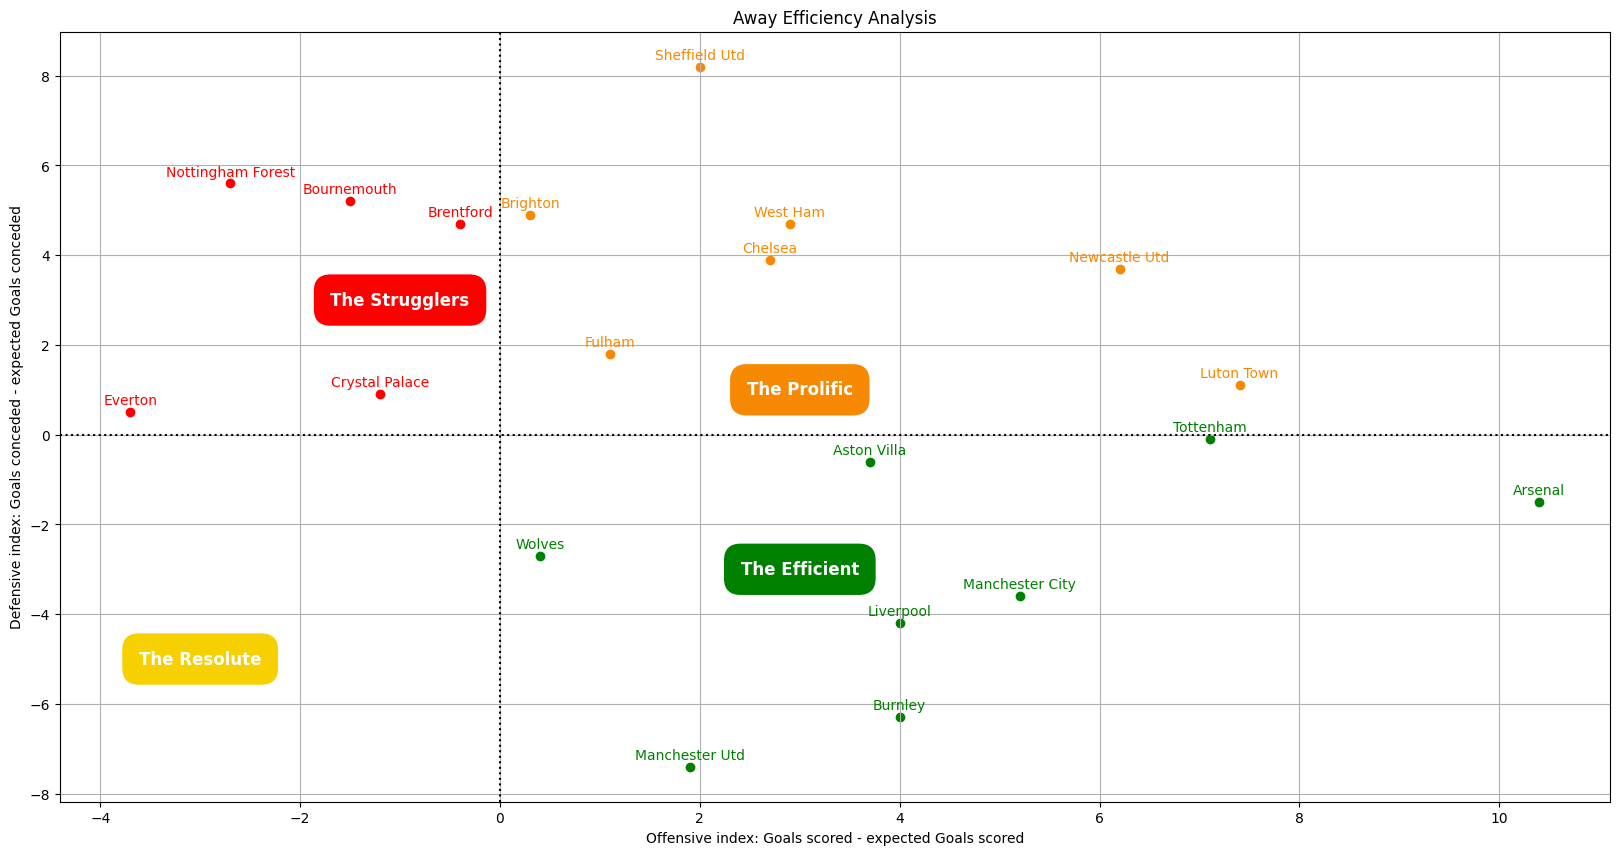
As you can see, no team are left in the Resolute category. Also, Liverpool or Aston Villa now are in the Efficient category, where Fulham and Brighton are now in the Prolific category.
Thank you for reading !
It's been such an exciting Premier League season! This was a great opportunity for me to mix both of my passion, football and data analysis, and to challege myself with a long-term project.
I really enjoyed gathering data from my various sources (fbref.com and Premier Injuries), creating my data files, exploring it, creating vizualisation to be easier for you to read and memorize, and finally writing and coding this article.
If you have any suggestion about other subjects that I am passionate about to do a project about it, feel free to contact me!
You can check the notebook where I did all the data analysis right here.
If you are interested about day-by-day prediction depending on injured players, previous results and difficulty index depending the opponent, you can check my notebook here.
Thank you very much for reading me and my work, I tried to do my best to deliver the best data and analysis possible.