
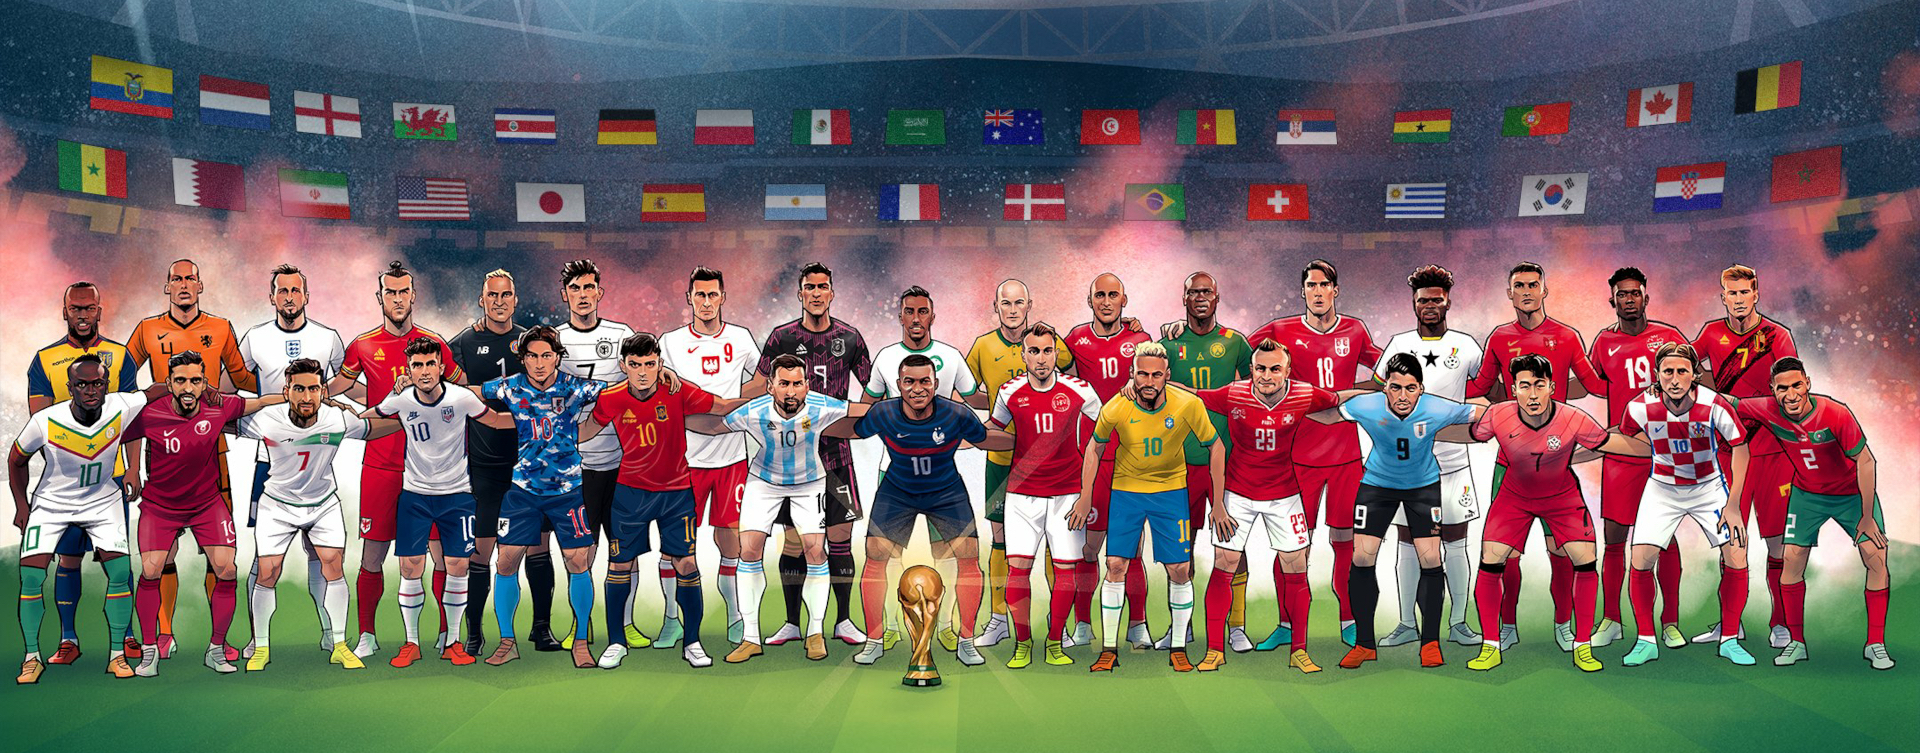
2022 FIFA World Cup in Qatar
An overwiew of the 2022 FIFA World Cup edition, with an interesting view of the sportive challenges the nations and players faced during this edition in Qatar.
2023 - Kevin Nicolas
In this article, we will see overall statistics about the 2022 FIFA World Cup, with sub-categories about:
- Players
- Nations
- Matches
- Coaching
- Comparison with other World Cup editions
- Going further
Players
Here are some of the players who have impressed this World Cup, others who haven't, based on their sportive performances.
Top scorer 🥇
Of course, in a football competition, we want to know who was the best scorer:
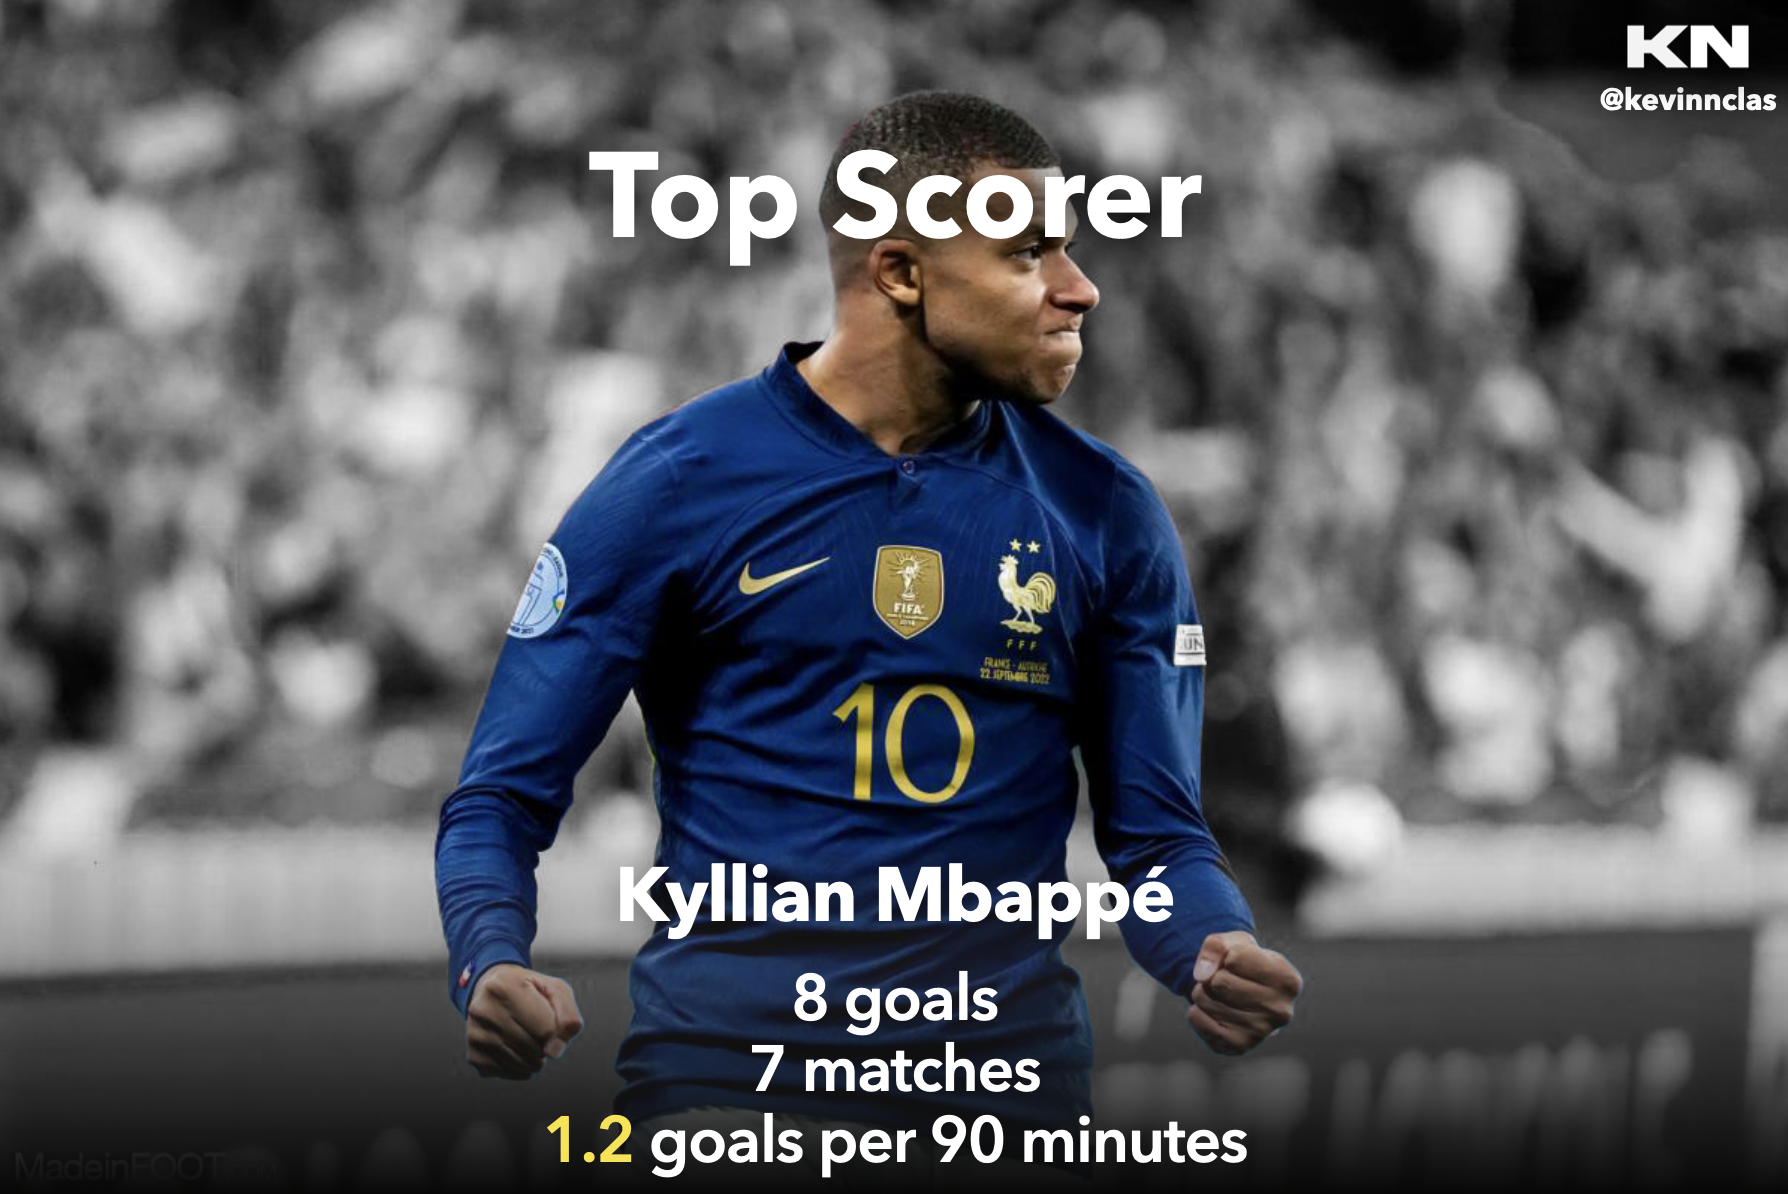
One man standing on the top scorer lead and that's Kylian Mbappé with 8 goals in 7 matches played.
With an incredible competition, we will see him again later...
Best assists 🥇
We also want to know who made the most assists in this World Cup:
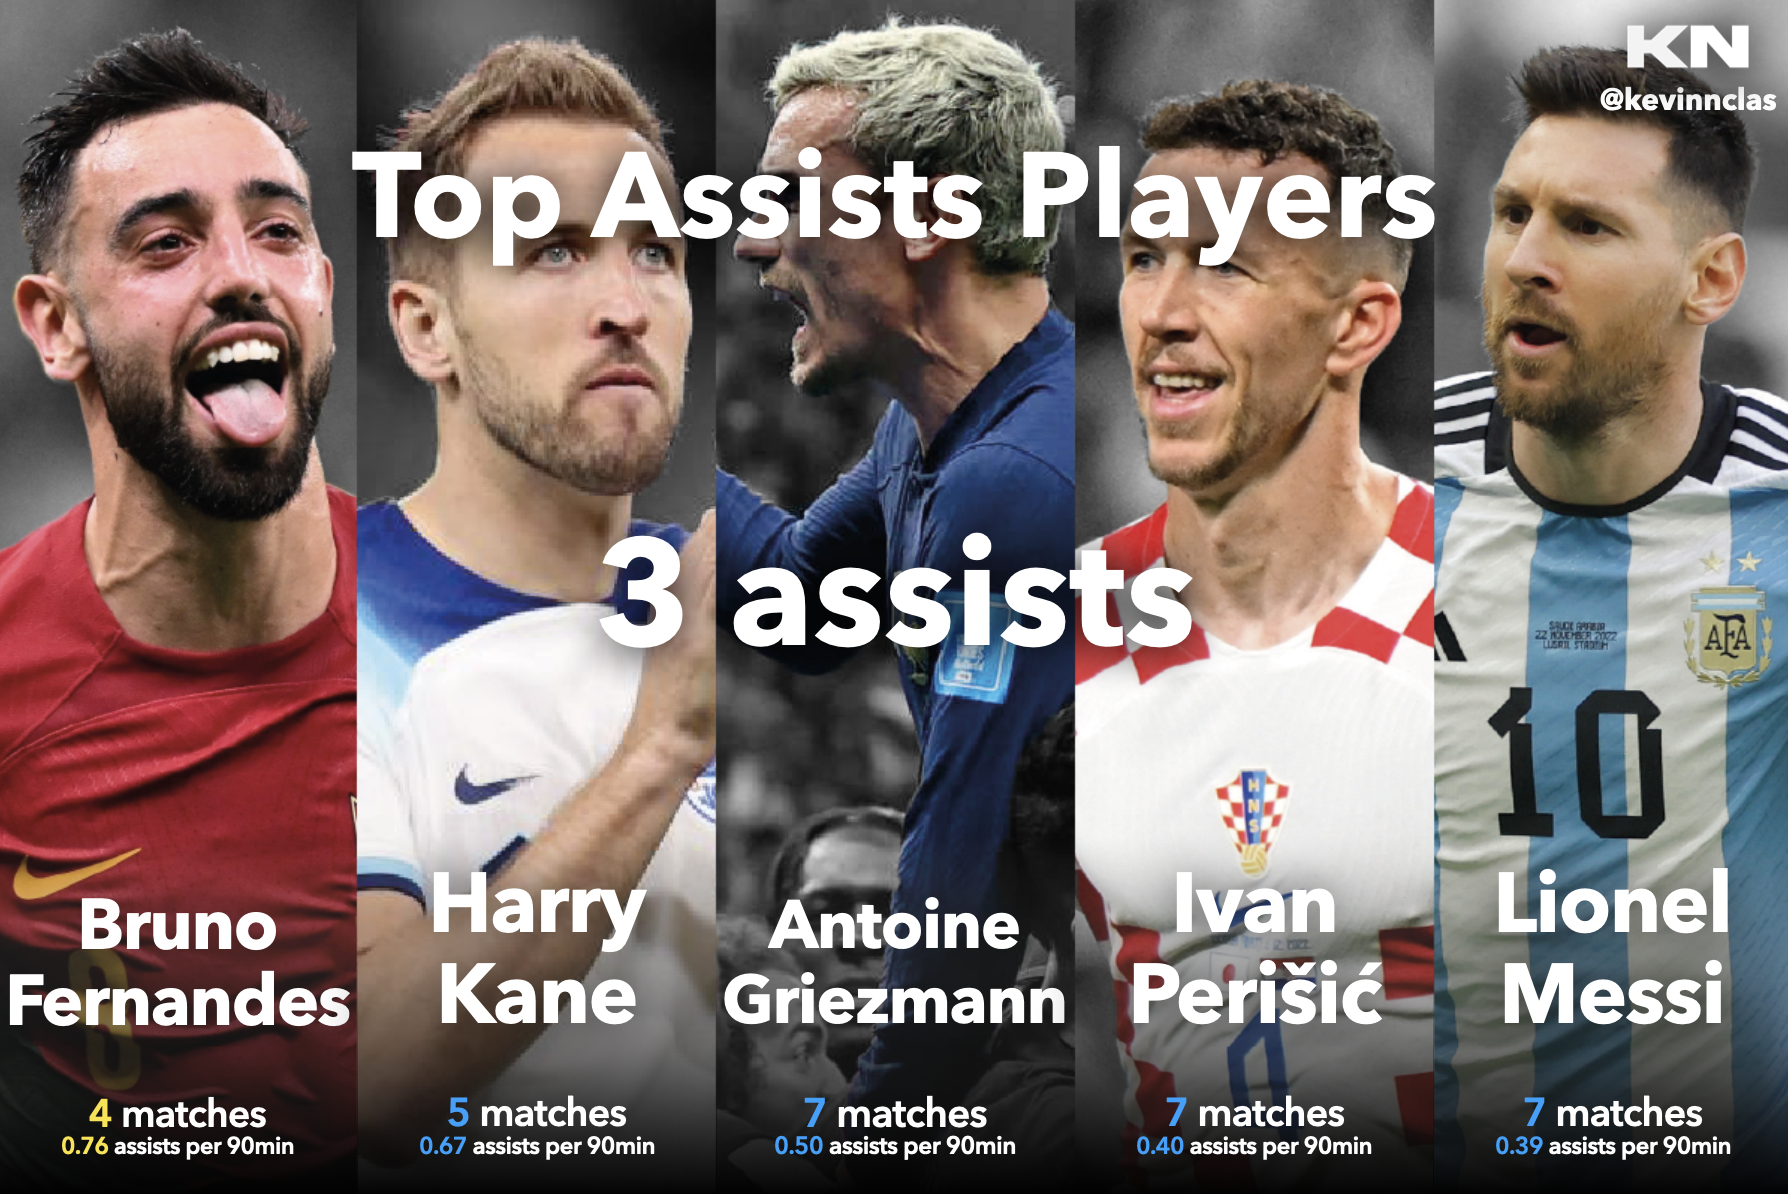
As for the assists, we have 5 players (Bruno Fernandes, Harry Kane, Antoine Griezmann, Ivan Perišić and Lionel Messi) that made 3 assists in the competition.
Honorable mention goes to Bruno Fernandes who made 3 assists in the least number of matches played, only 4.
Most decisive player 💪
If we combine goals & assists, we can go a bit further and see who was the most decisive player of the competition:
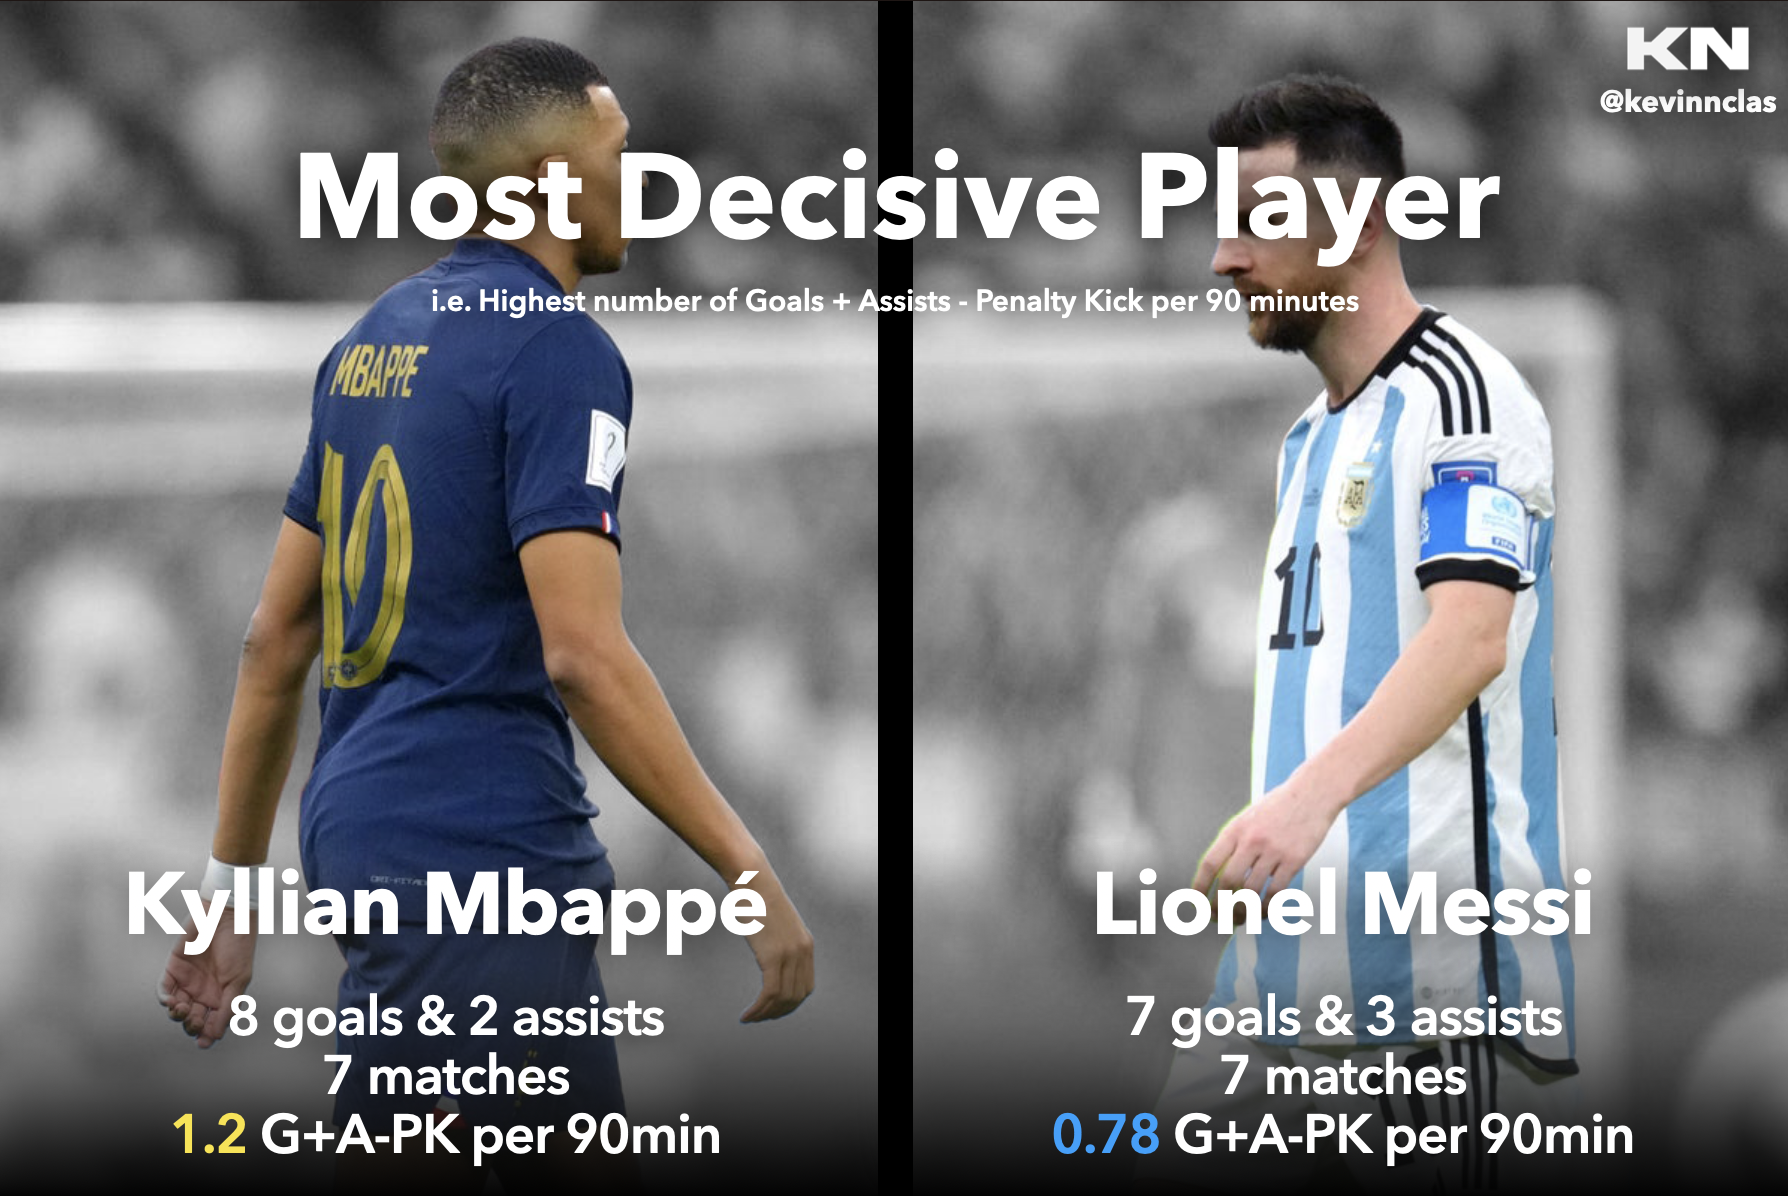
If we only focus on the total of goals and assists, Kylian Mbappé and Lionel Messi are tied to a score of 10, with an advantage to the French phenomenon who scored 8 goals versus 7 goals for the Argentinian magician.
But, if we go deeper and watch Goals + Assists - Goals scored on Penalty Kicks made per 90 minutes, we can see that Kylian Mbappé is more decisive, with a score of 1,2 versus 0,78 for Messi.
So we can conclude that Kylian Mbappé, in addition of being the top scorer of the competition, is also the most decisive player of the competition. What a journey for the 24 years old player!
Youngest & oldest players 👶👴
During the World Cup, we often have some players that are experimented, others less. Let's see who are the youngest and the oldest player of the competition:
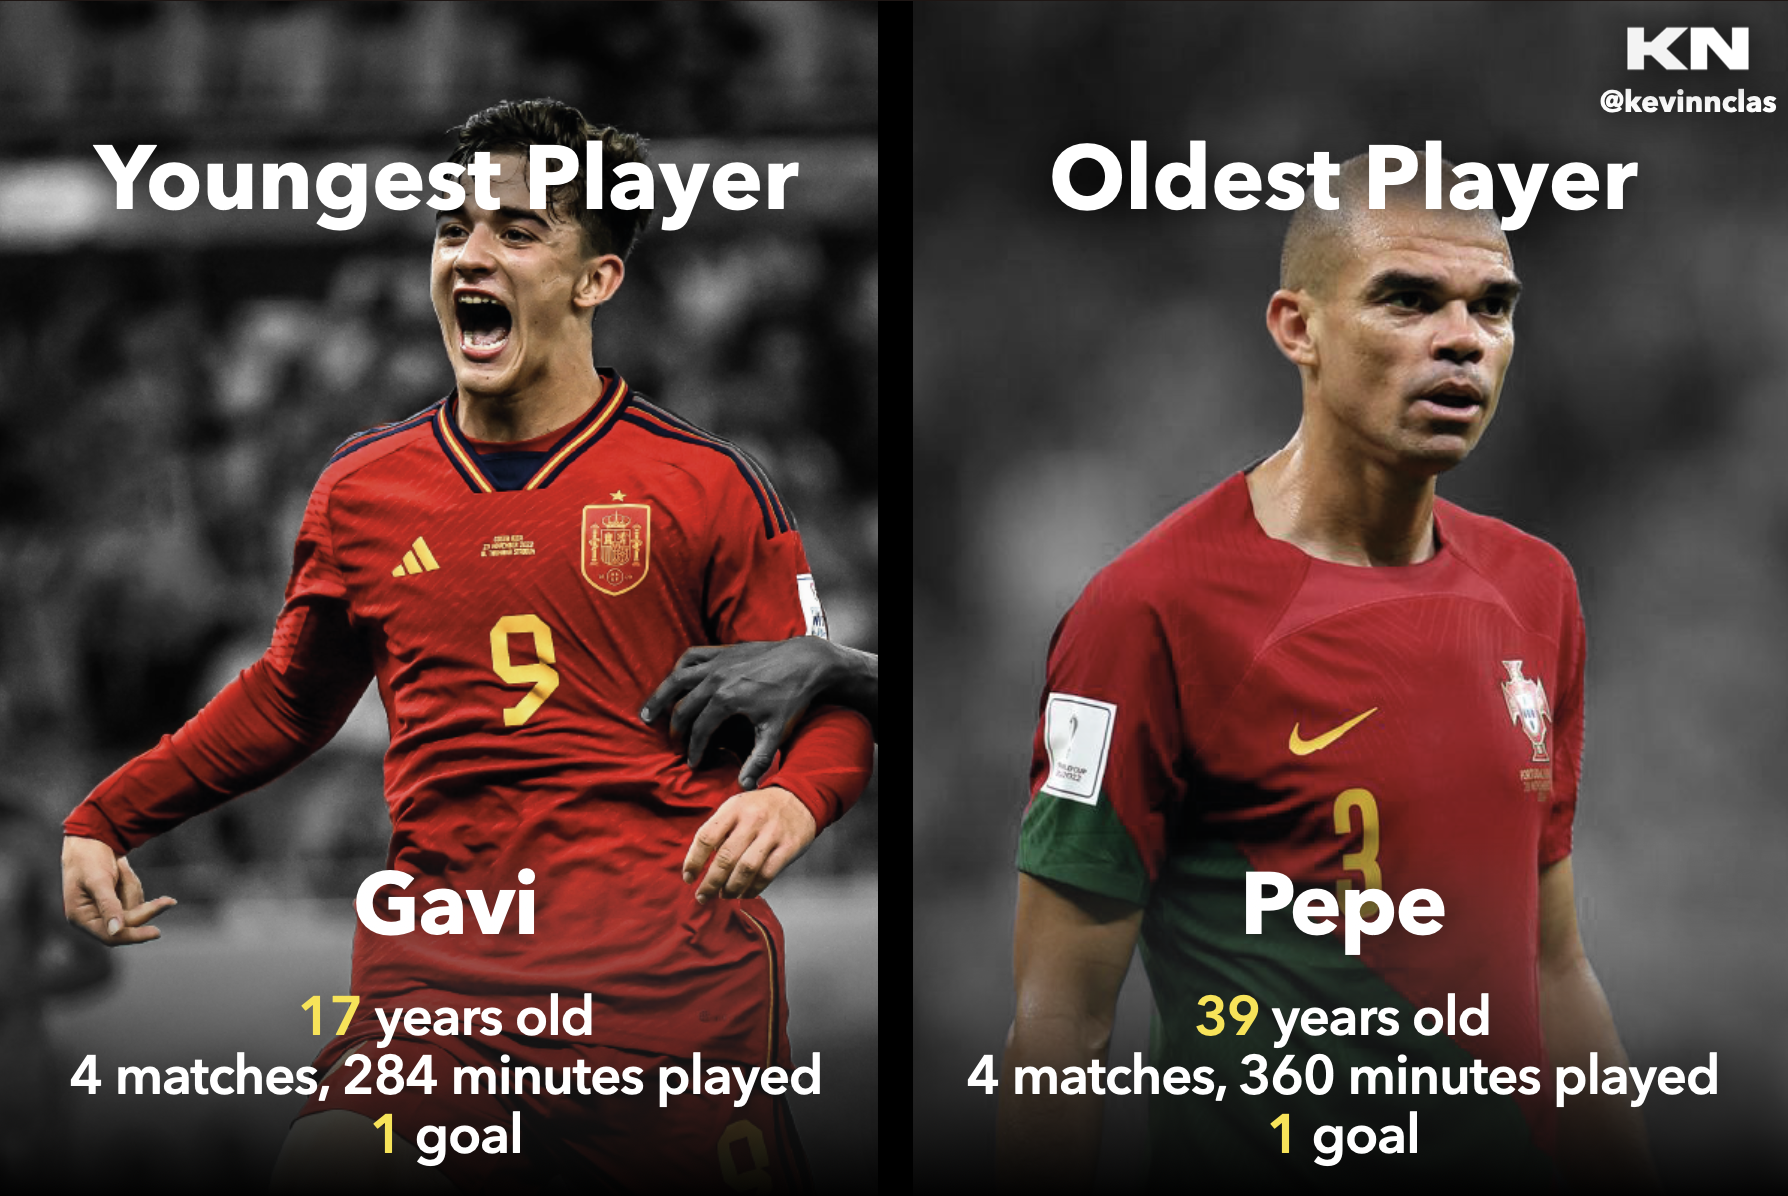
For the youngest players, we have 4 players (Gavi, Jewison Bennette, Garang Kuol and Youssoufa Moukoko) that only had 17 years old during the competition. Also, they all played at least one match.
I wanted to highlight Gavi that made an incredible appearance for his age, who started 4 matches with Spain and even scored 1 goal.
For the oldest players, we have 5 players (Pepe, Atiba Hutchinson, Dani Alves, Eiji Kawashima) aged 39 years old. At this age, to still be at this level of performance, is already remarkable. Among those players, 3 of them were able to play at least one match during this World Cup.
The honorable mention is attributed to Pepe, who scored 1 goal for Portugal and who played 4 matches and 360 minutes at 39.
Most effective player 🎯
Now, let's see who was the most effective or surprising player of the tournament, i.e. (Goals + Assits) - (Expected Goals + Expected Assists):
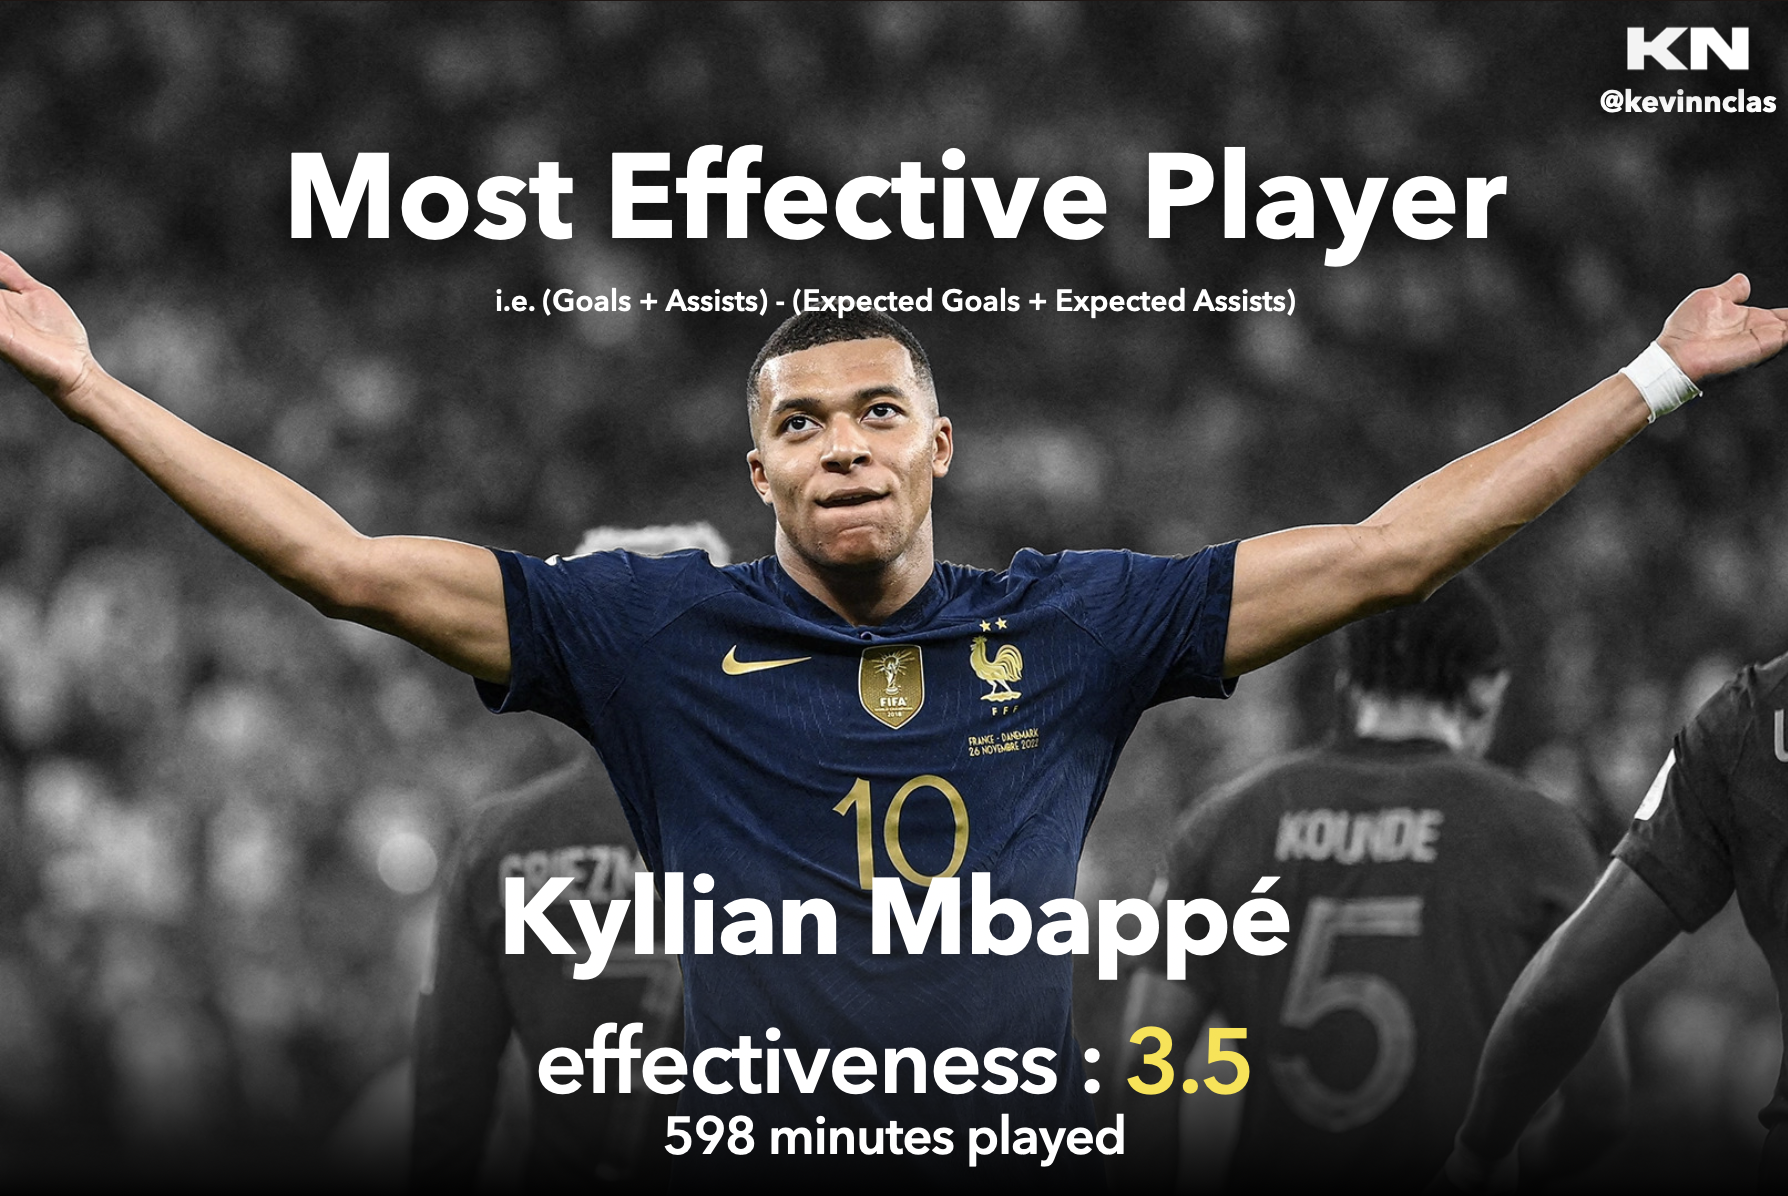
Once again, Kylian Mbappé, with an effectiveness score of 3.5, i.e. 3,5 times more decisive than expected, is the leader of this metric.
Most disappointing player ☹️
On the other hand, we can have the most disappointing player of the competition, which is attributed to the player who was expected to score or make an assist but did not do so the most times.
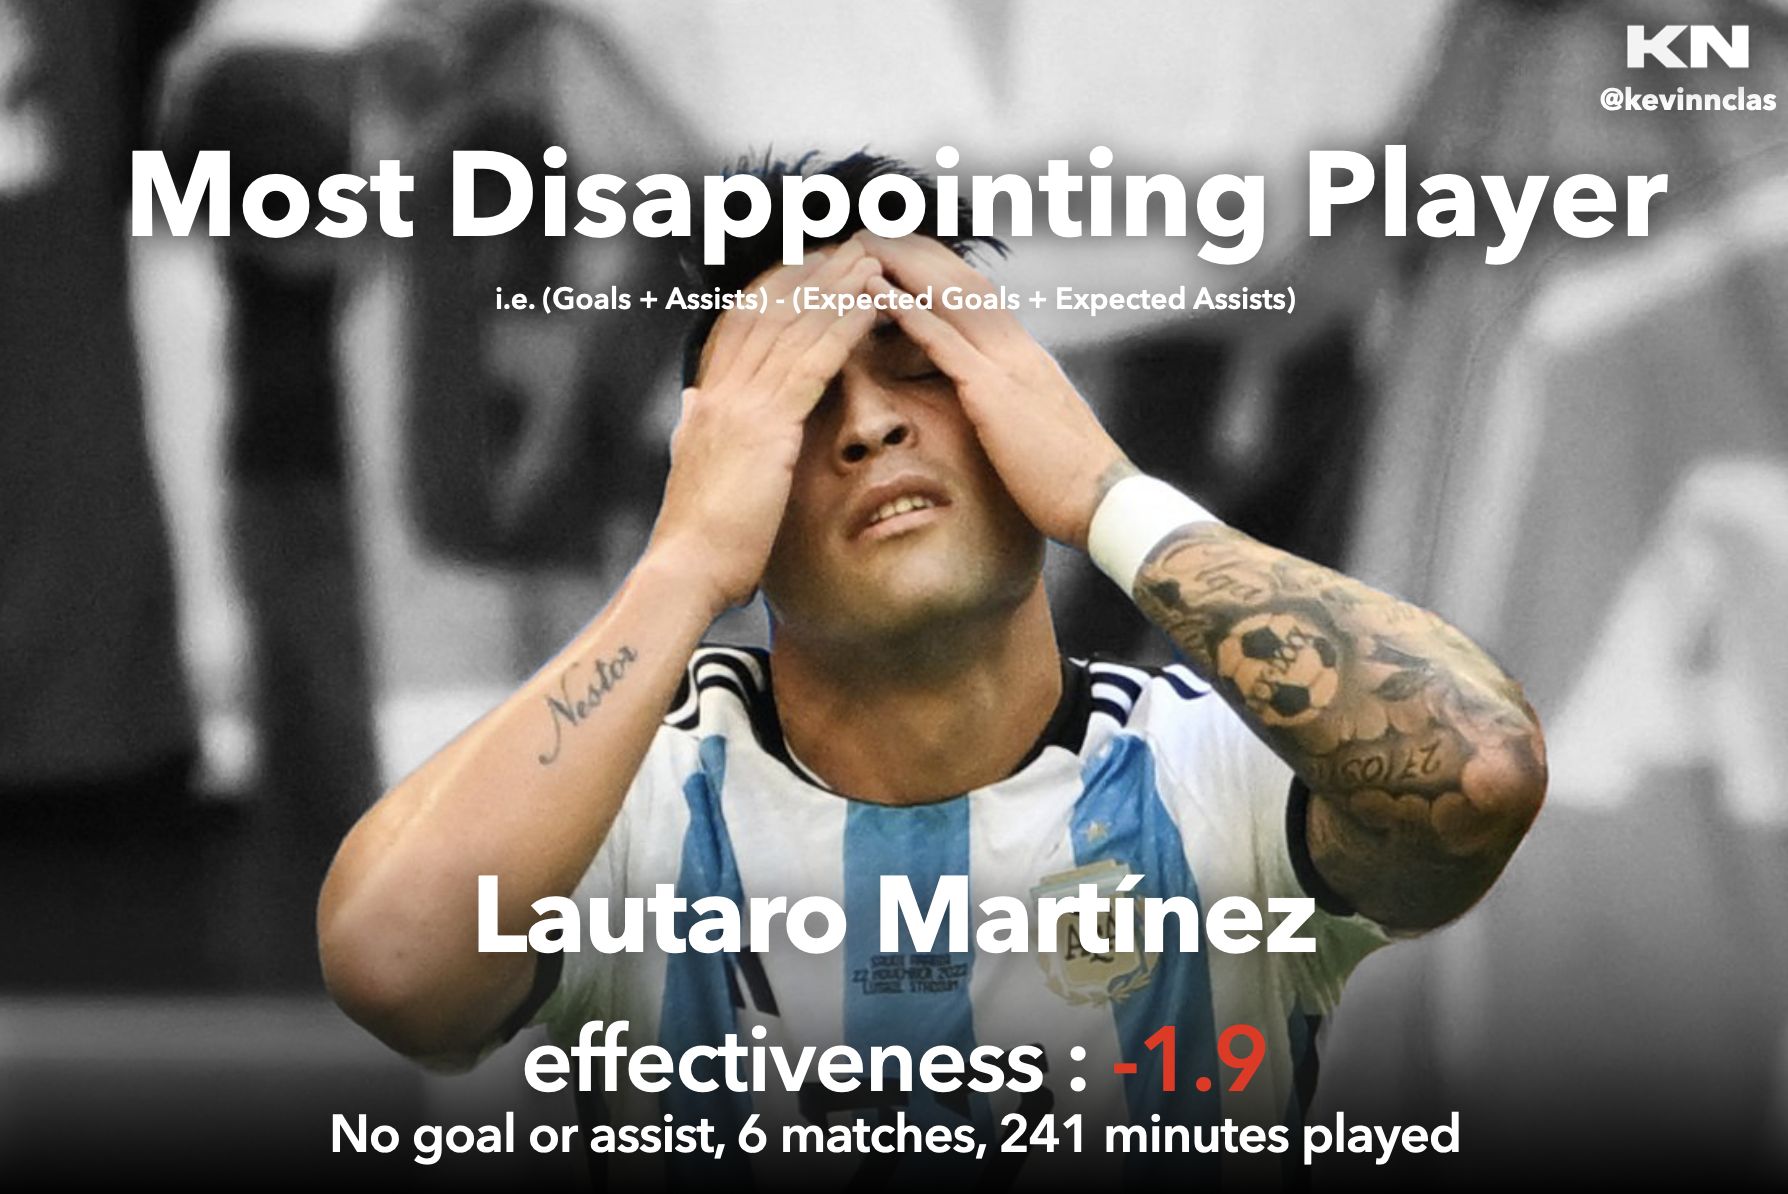
Unfortunately, this title is assigned to Lautaro Martínez, who played 6 matches and 241 minutes but didn't score or made any assist during his games... He was expected to be 1,9 times more decisive that he actually was.
Super Sub of the competition 🦹
The title of "Super Sub" is given to the player who has replaced another during a match, and who has scored or made an assist after coming in the most times.
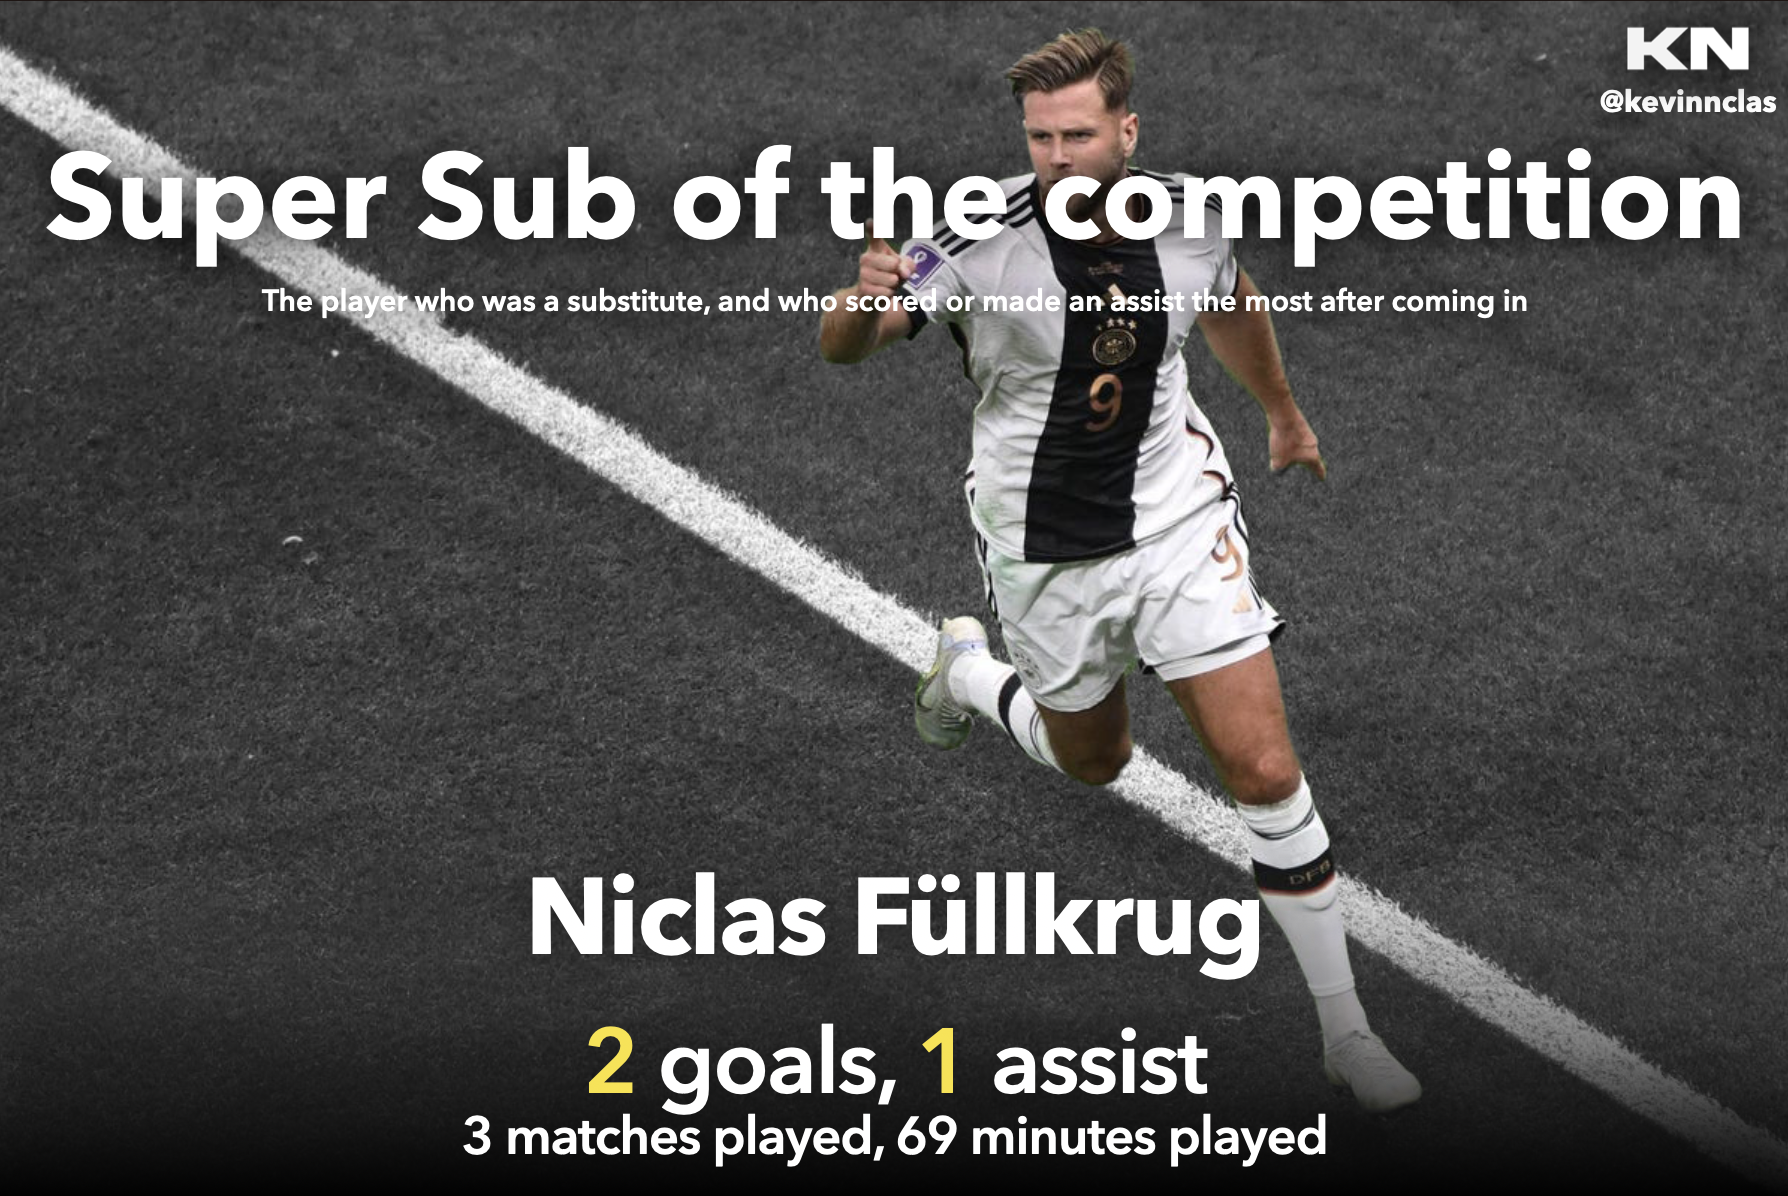
As a result, we have two players that made an assist or scored a goal after joining a game 3 times.
Those players are Niclas Füllkrug for Germany and Álvaro Morata for Spain. An honorable mention for Niclas Füllkrug, who only played 3 matches, one less than Morata.
Most scoring league 🏅
With players from all over the world, who play in differents clubs and countries, I wanted to see which league was the one that has the most scorers in this World Cup:
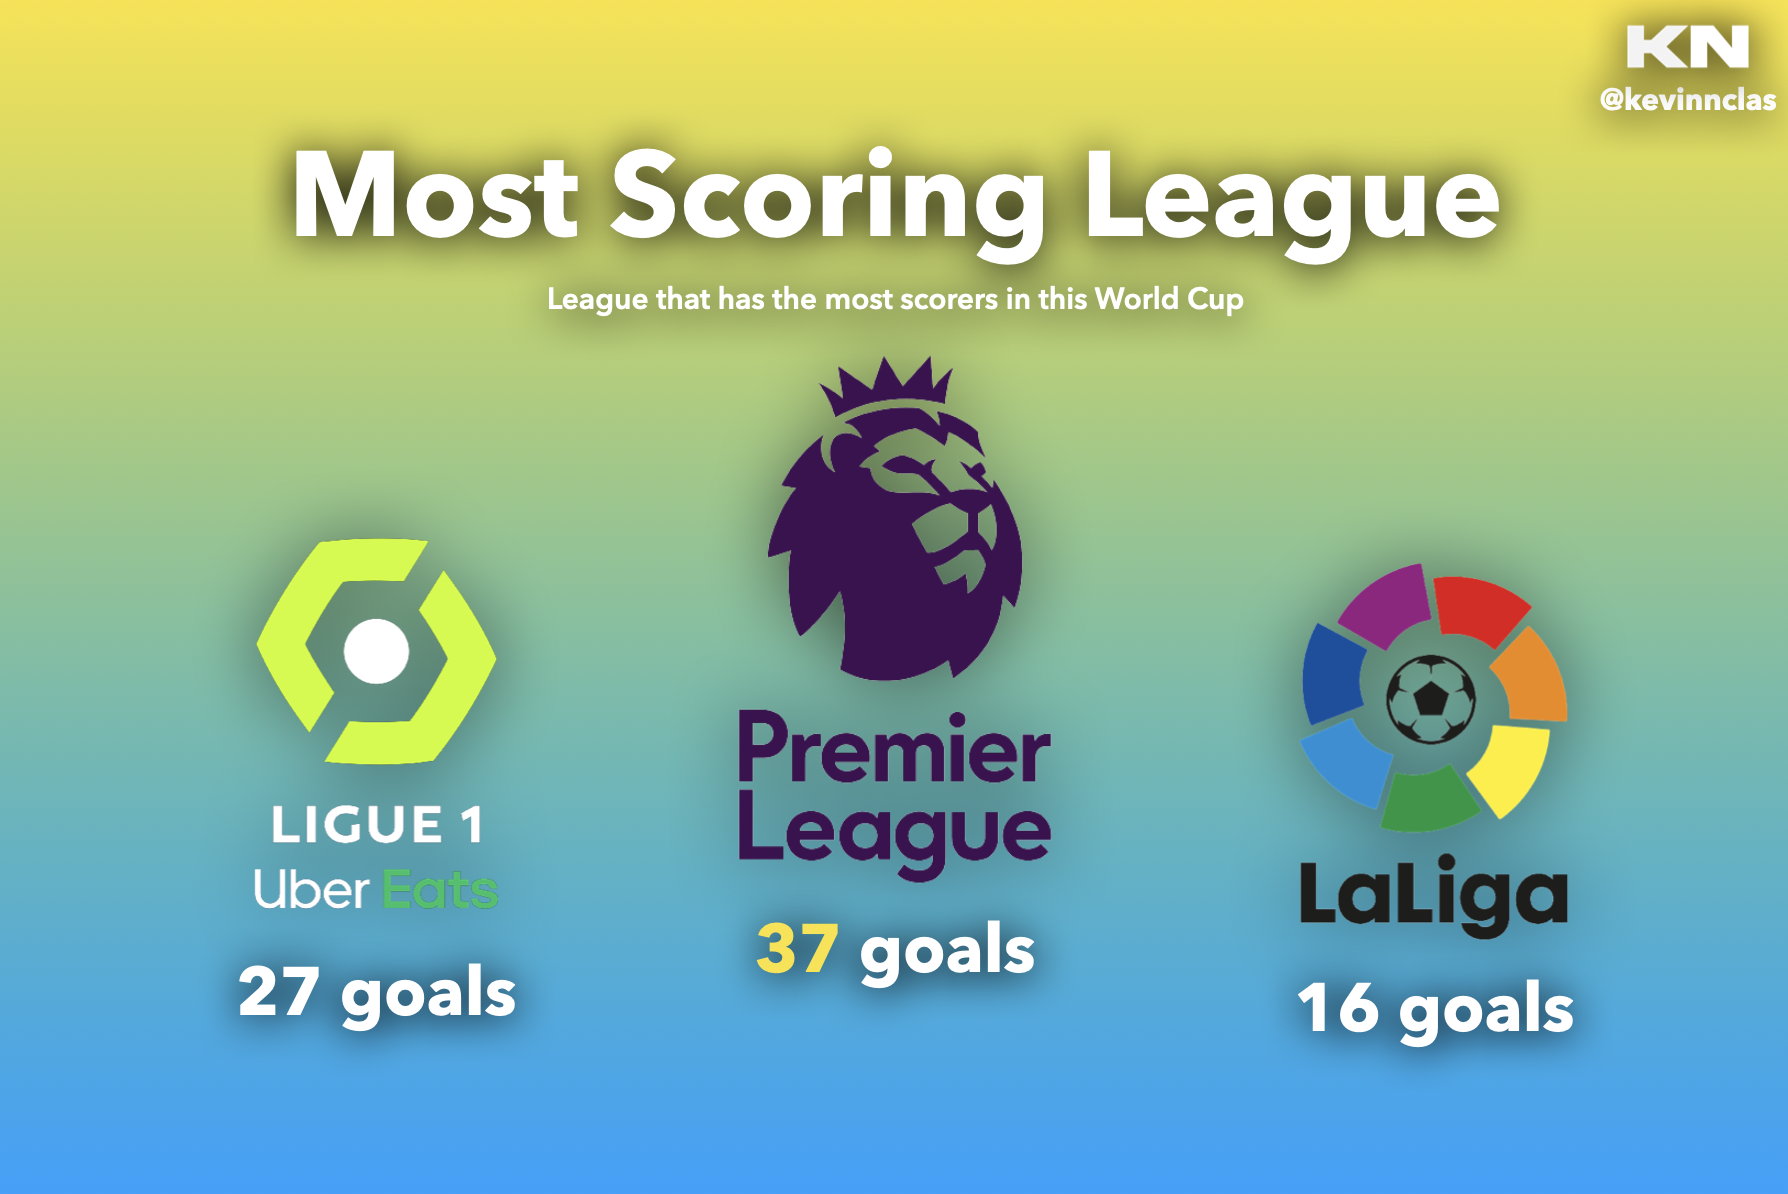
With 24 leagues represented, the 1st League of England, knowned as Premier League, is the most scoring league, with 37 goals scored from its players.
In second position, we have Ligue 1 from France with 27 goals, and in third place we have La Liga from Spain with 16 goals.
Nations
Now, we will focus on nations who have impacted this World Cup and on others who haven't, based on their sportive performances.
Most Wins 🥇
First, let see which nation won the most matches:
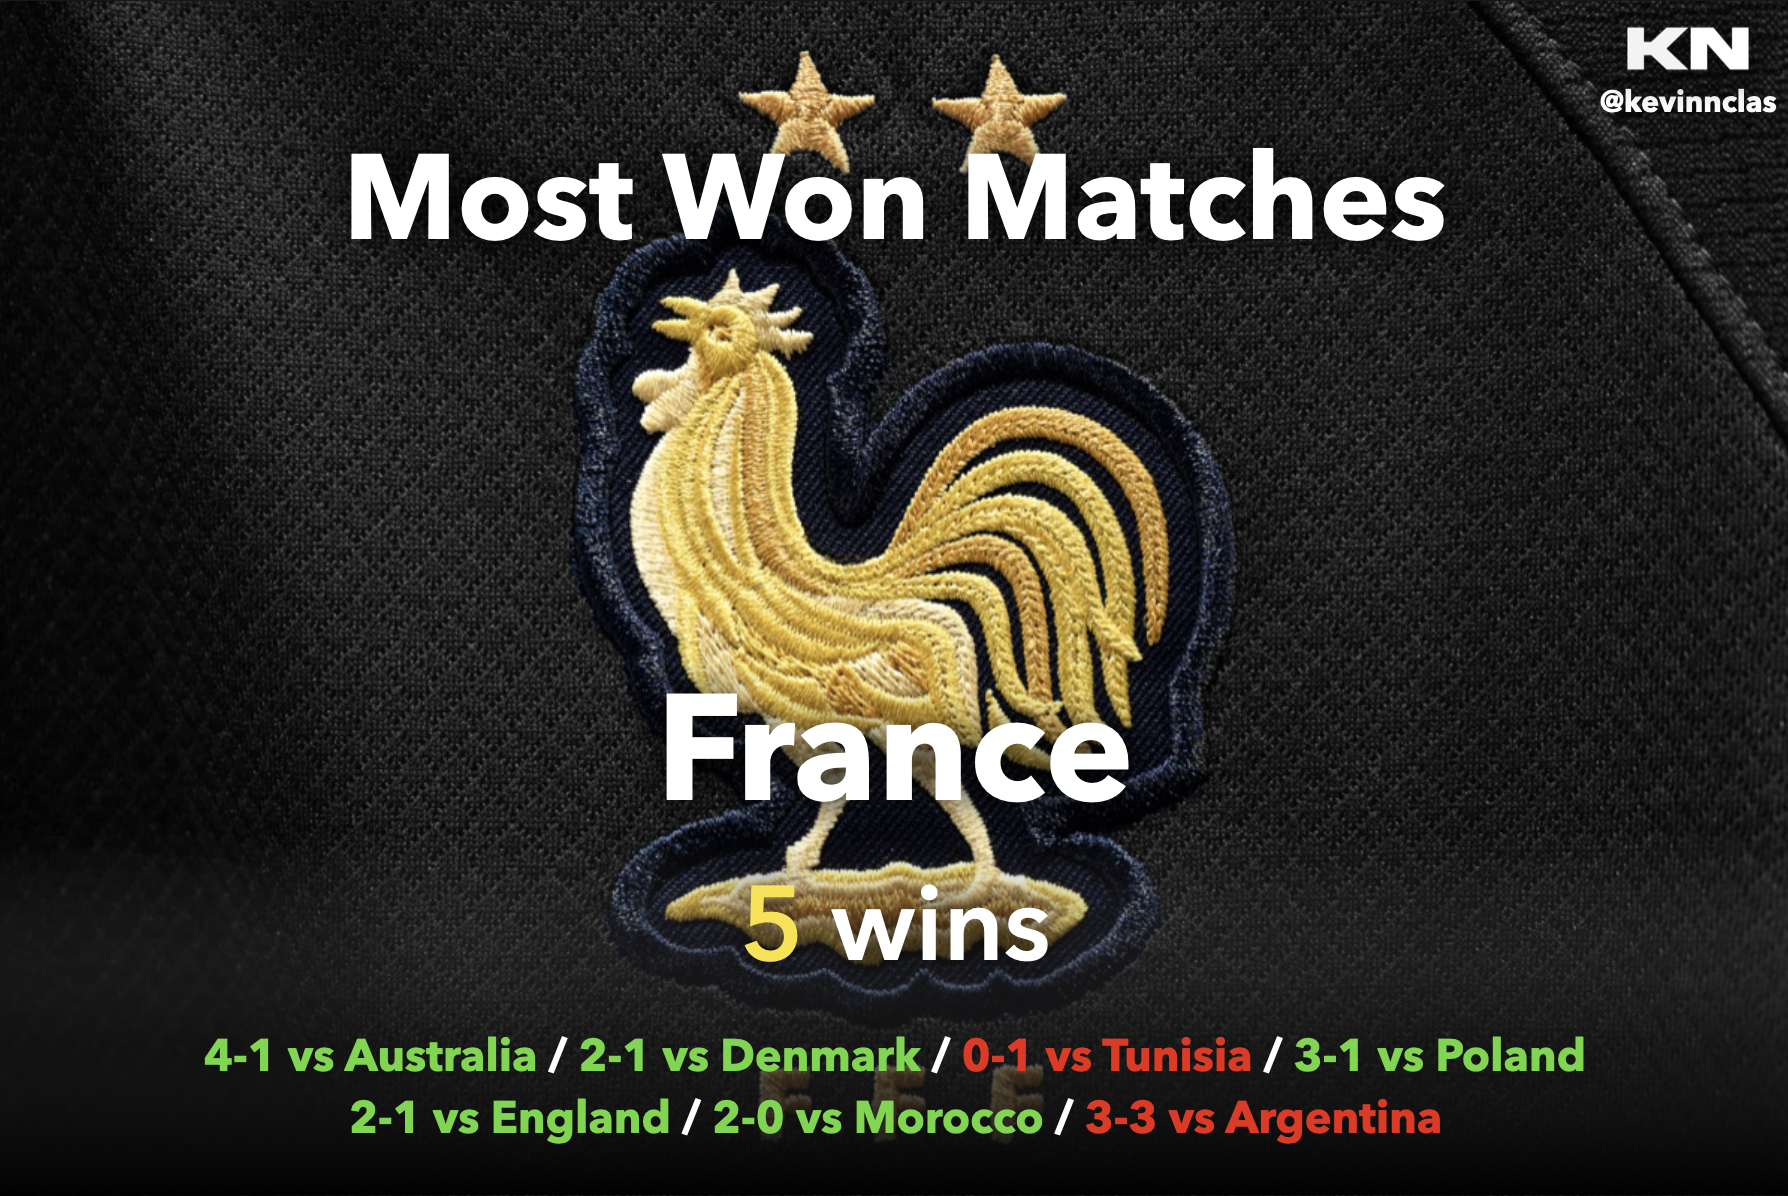
If we are looking the number of wins, we can see that the two finalists, France and Argentina, are logically on top on the ranking.
But with 5 wins (wins before a penalty shootout), France is the nation that won the most games.
With a great journey in this competition, it's sad for France not to have won this World Cup. In fact, they only lost 1 game against Tunisia (nation that we will see later), and draw against Argentina, the World Cup Champion.
I thought it could be also interesting to know which continent won the most matches. In the following graph, there are the number of wins per continent:
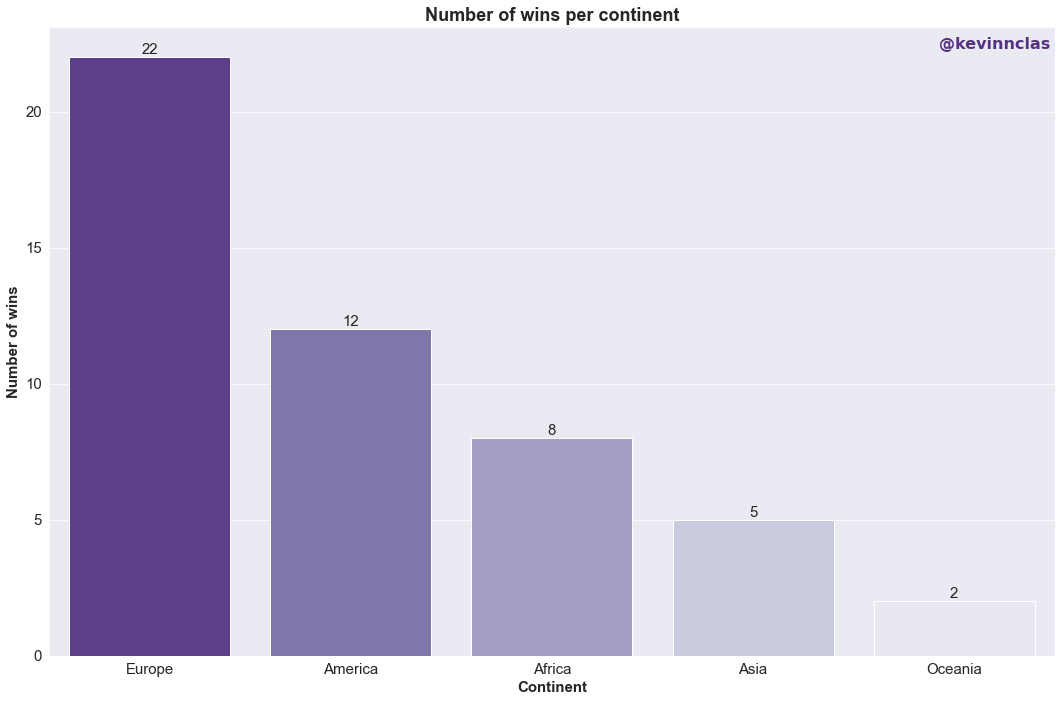
As for continents, we can see that Europe is the continent with nations that won most of their games, with 22 wins.
Of course, the variation and repartition of this graph is strongly impacted by the number of nations represented by each continent, which is not the same for all the continents.
But, if we normalize the amount of wins by the number of nations represented in each continent, the ranking changes:
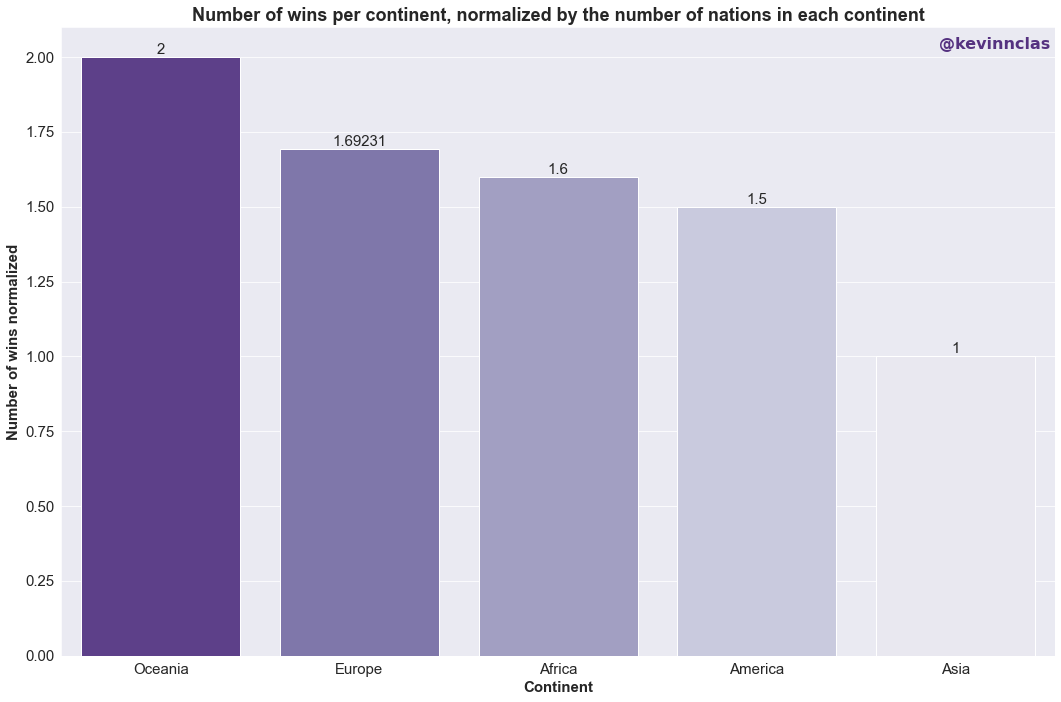
Because Oceania only has Australia as a representative, and because Australia won 2 matches, it is now the leading continent in terms of won matches, closely followed by Europe.
NB: Here, we don't talk about confederations, but geographical continents. In fact, Australia is part of the AFC (Asian Football Confederation) and America is split in half, with CONCACAF (Confederation of North, Central American and Caribbean Association Football) and CONMEBOL (South American Confederation).
Most offensive team ⚽️
Let's see which nation had the most offensive team:
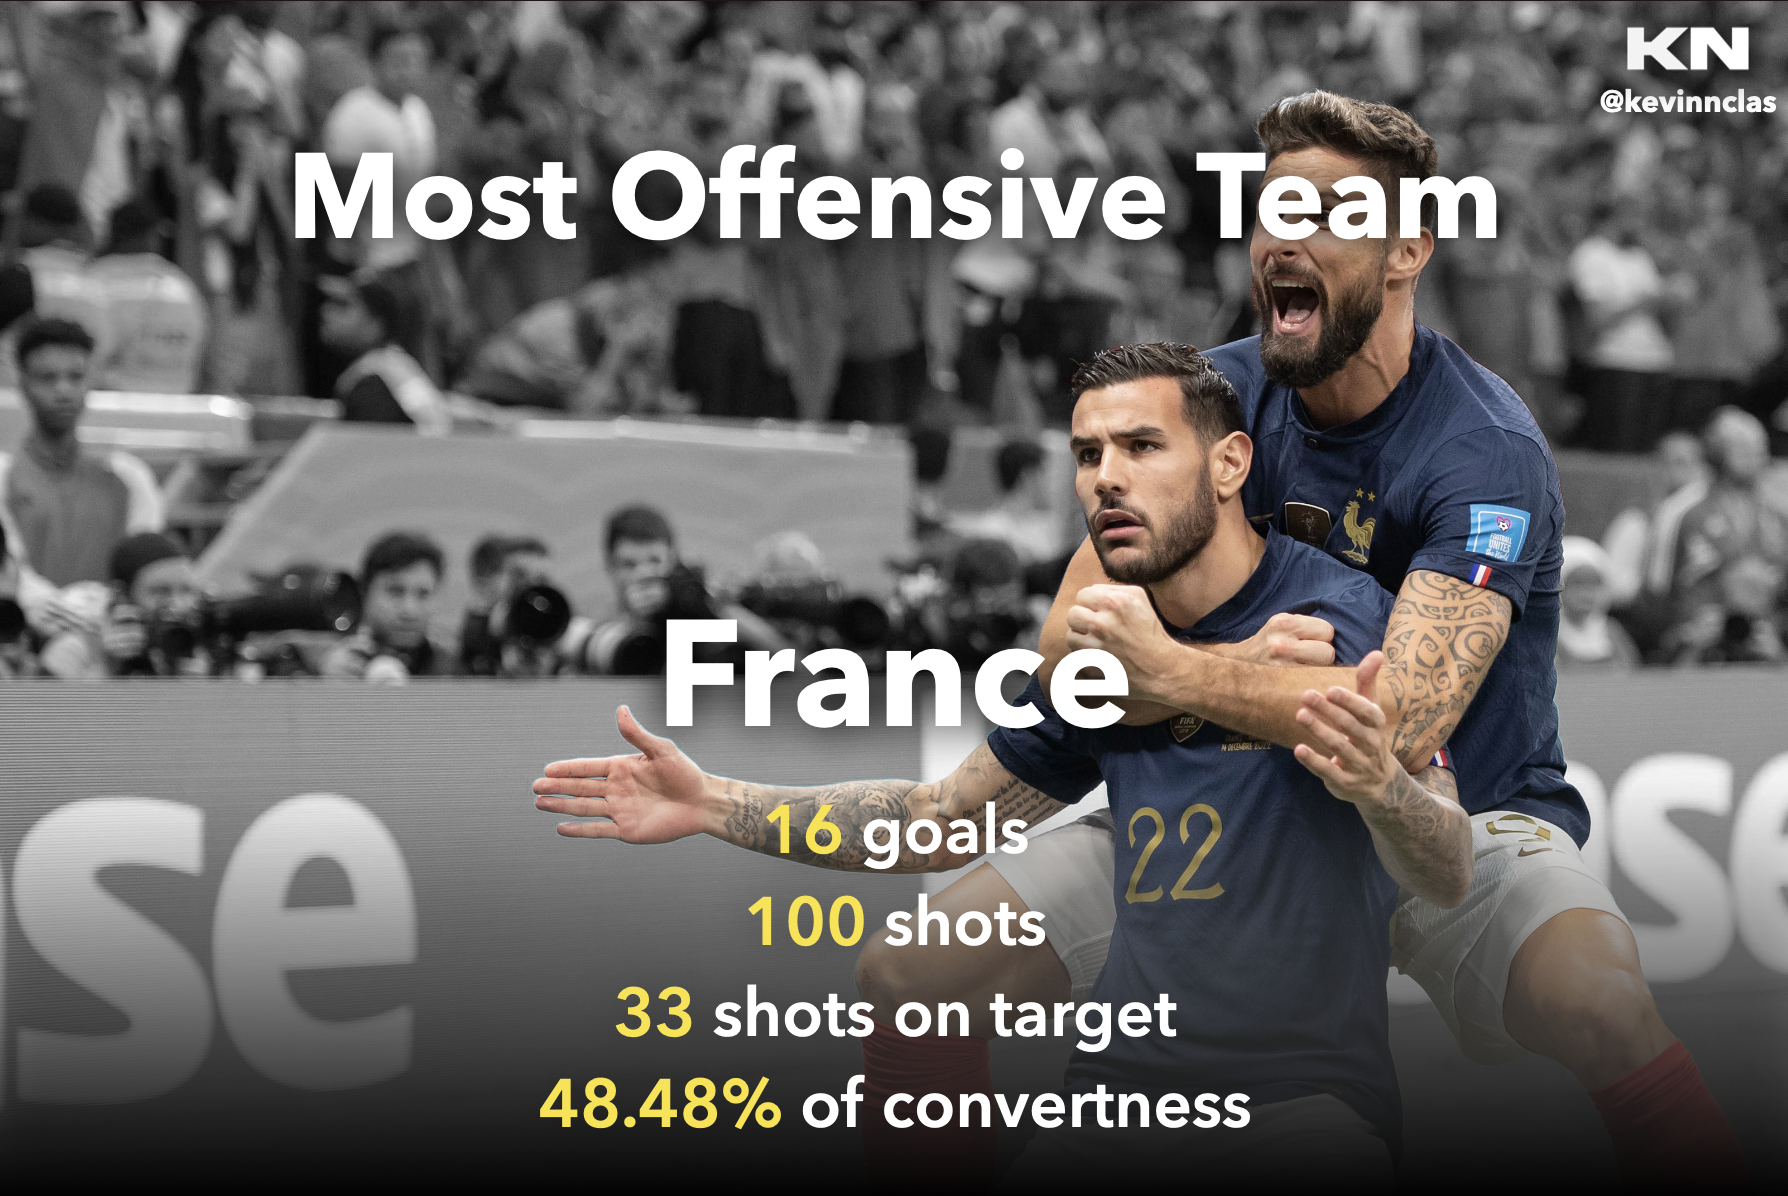
Ranked by the number of goals scored, then by number of shots on target and finaly by number of shots, the most offensive team of this World Cup is France, with 16 goals, 33 shots on target and 100 shots.
But if we sort by the number of shots on target first, Argentina is first, with 15 goals for 41 shots on target. It is normal to find the two finalists of the competition as the two most offensive teams.
France is the only team that reached 100 shots.
Most defensive team 💎
To determine which team had the best defense, I took into account the number of goals conceded, the number of shots on target conceded and the number of shots conceded. After that, I normalized per match played for each team.
I sorted the results first by the number of normalized goals taken, then the number of games played, then the number of normalized shots conceded and finally the number of normalized shots conceded.
Let me explain why I chose this order for the ranking of the defensiveness of the teams:
- The first is the number of goals conceded in ascending order: it's the most obvious indicator, because if a team has a great defense, it doesn't take goals.
- Second is the number of match played in descending order: the more you played games and the least you took goals, the better your defense was.
- Then, the number of shots on target conceded in descending order: if you take a lot of shots on target but don't take many goals, it means you have a great goalkeeper and he is the last bastion of your team.
- Finally, the number of shots conceded in ascending order: I assumed that the least shots conceded, the better defensive pressure was applied to prevent a shot from the other team.
At the end, we have this result:
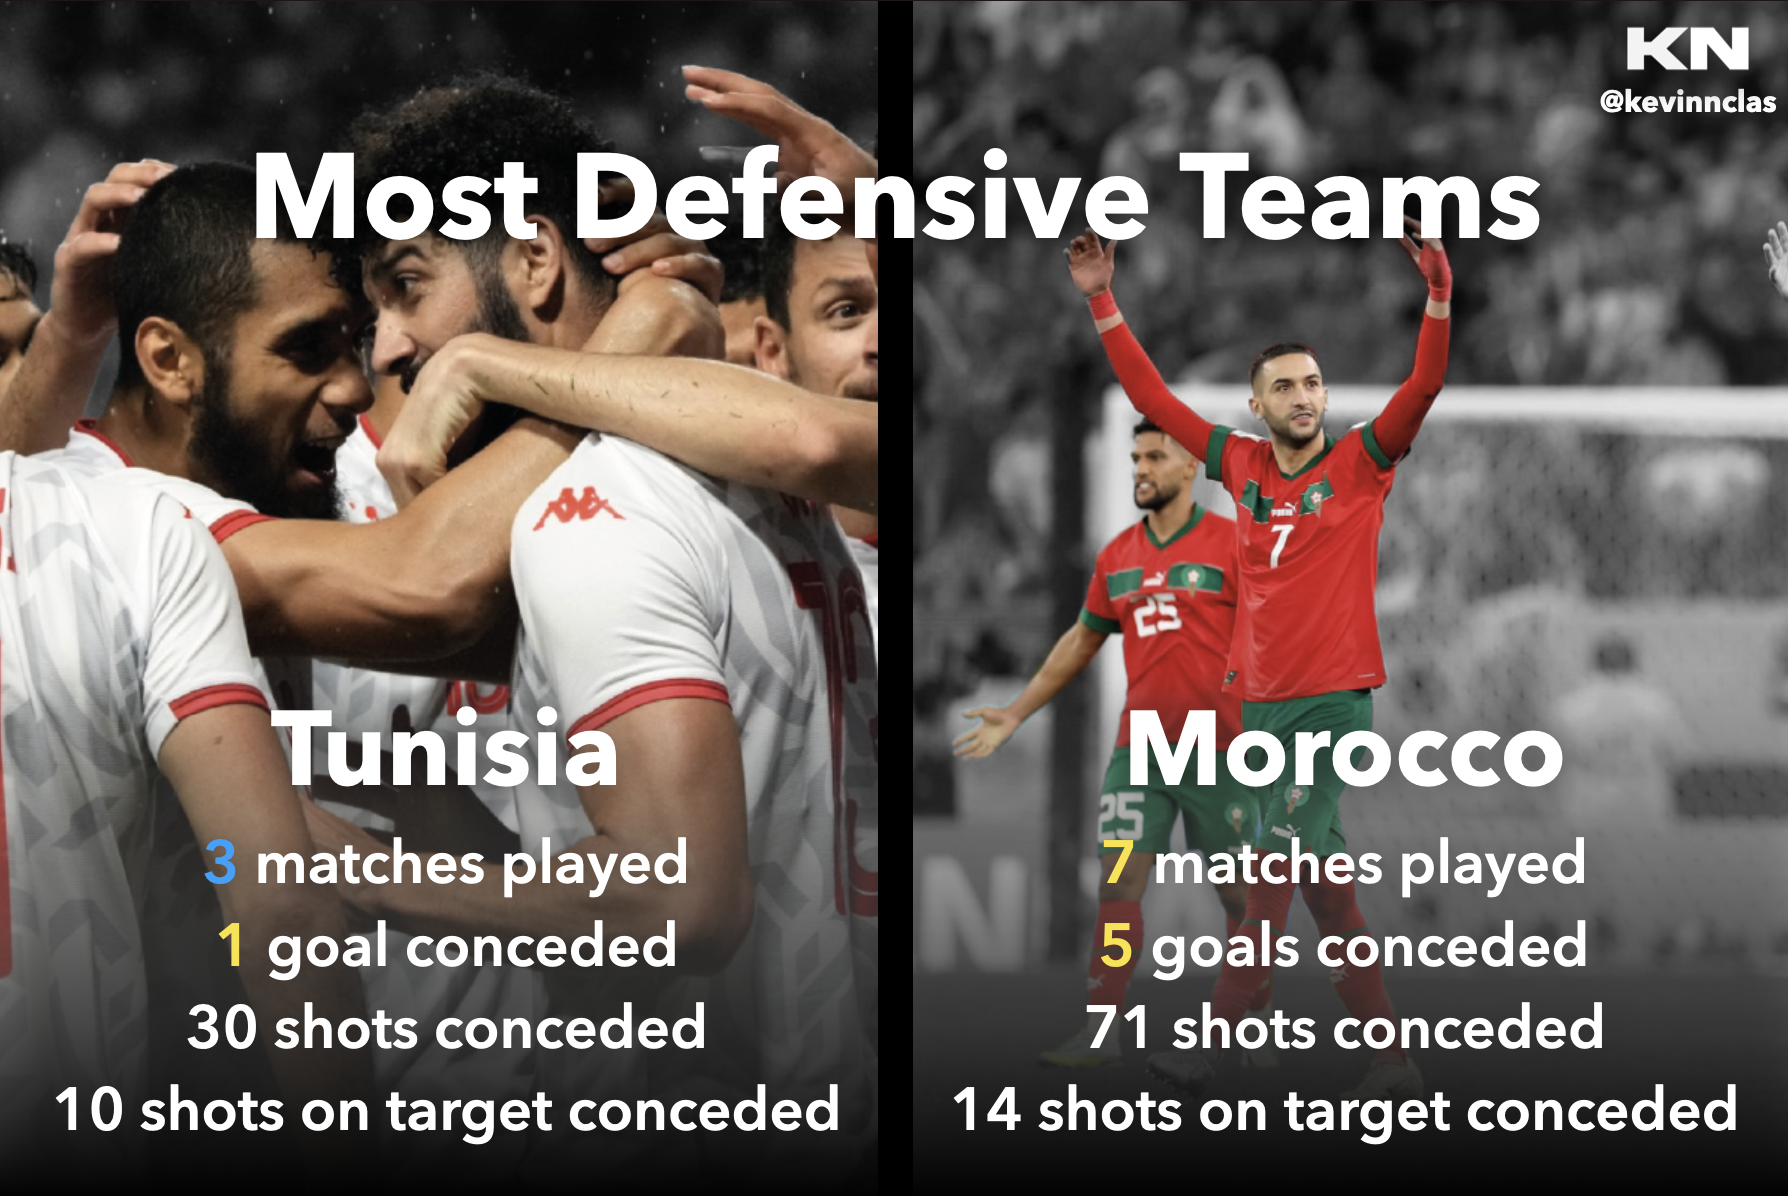
So, with my ranking method used, we have Tunisia as the best defensive team of the tournament (1 goal conceded, 10 shots on target and 30 shots conceded in 3 matches played).
I normalized the data to get closer to reality, because the teams didn't played the same amount of games. But this technique of normalization is not really the best way to approach a true reality. In fact, the gap of games played on which we made the normalization is not big enough to have an effective normalization and a good representation of reality.
If we look only the final four nations (Morocco, Croatia, Argentina and France), Morocco has the best defense of the tournament, with 5 goals conceded, 14 shots on target and 71 shots conceded in 7 matches played.
Most decisive team 🎯
Now that we saw the most offensive and the most defensive team, I thought it was interesting to have the most decisive team, or most effective team, i.e. Goals - Expected Goals:
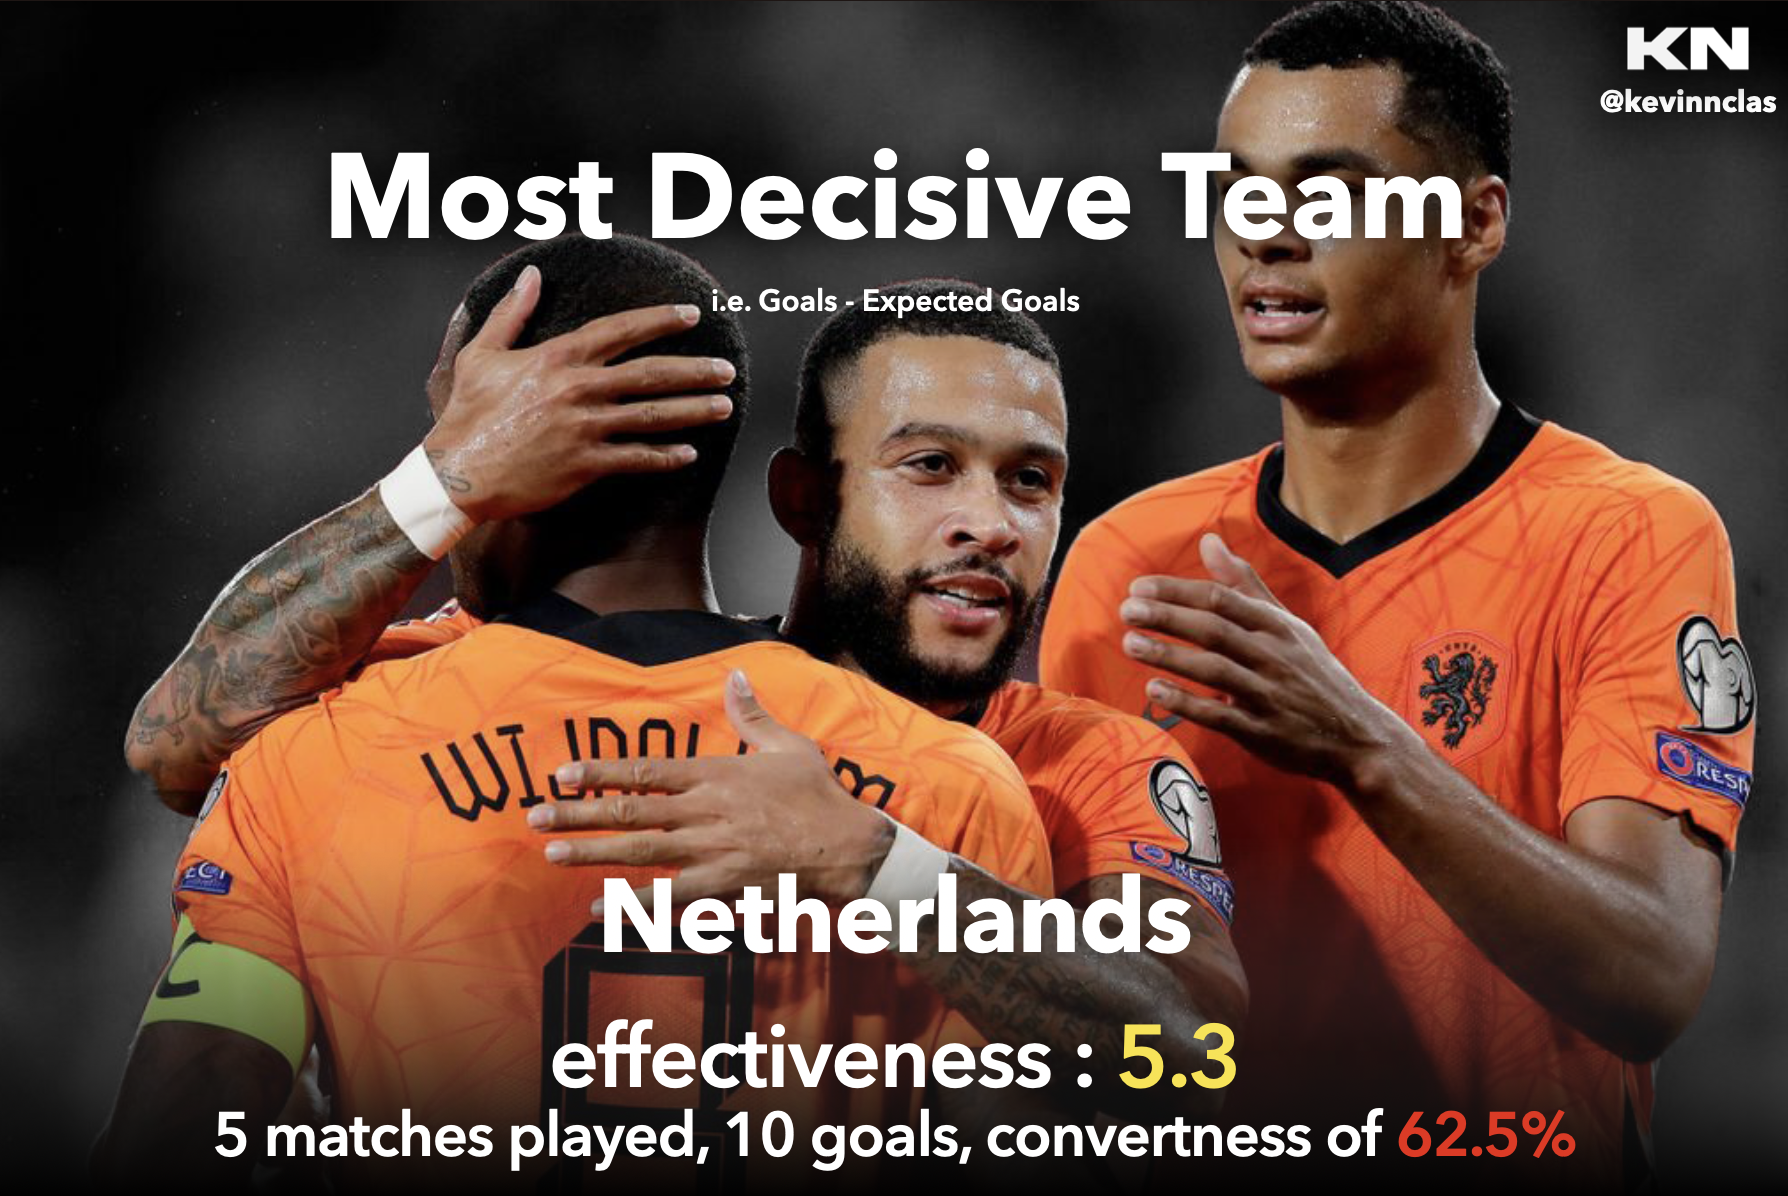
The most effective team is Netherlands, which was 5,3 times more decisive and effective than expected.
This metric can be correlated to the convertness of the team. In fact, Netherlands has the best rate of convertness in this competition. This means that 62,5% of Netherlands' shots on target were converted into goals.
Most disappointing team ☹️
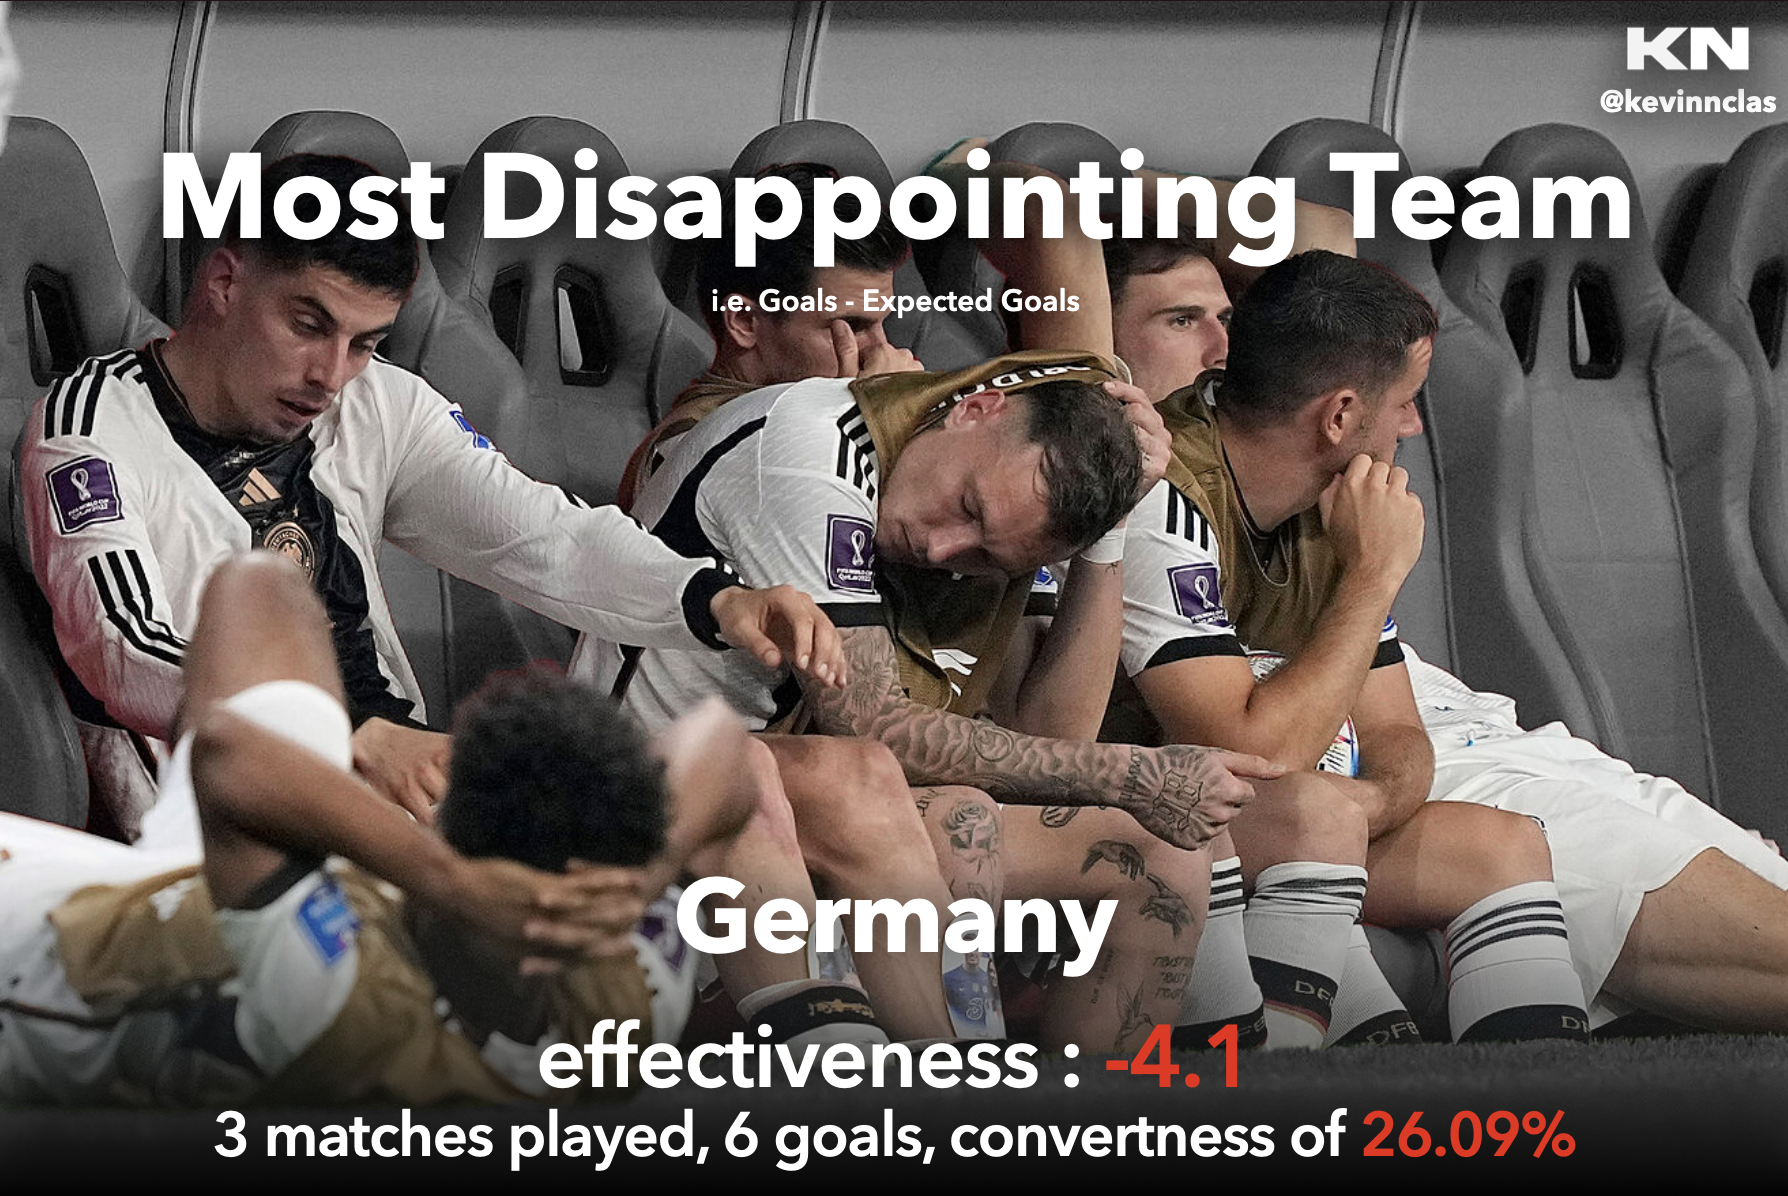
On the other hand, the most disappointing team was Germany, who was expected to score 4,1 times more than it actually scored.
Looking at Germany's convertness score, we can see that only 26,09% of Germany's shots on target were converted into goals. The team is in the 22nd place of the 32 teams in the tournament for this metric, which can explain why they are the most disappointing team, based on their performance.
Most violent team 🟨
If you looked the behavior of each team during the matches of this World Cup, you could have detected some nations that were particularly more aggressive or violent. I wanted to see which team was the most violent team, looking at the number of yellow cards by team:
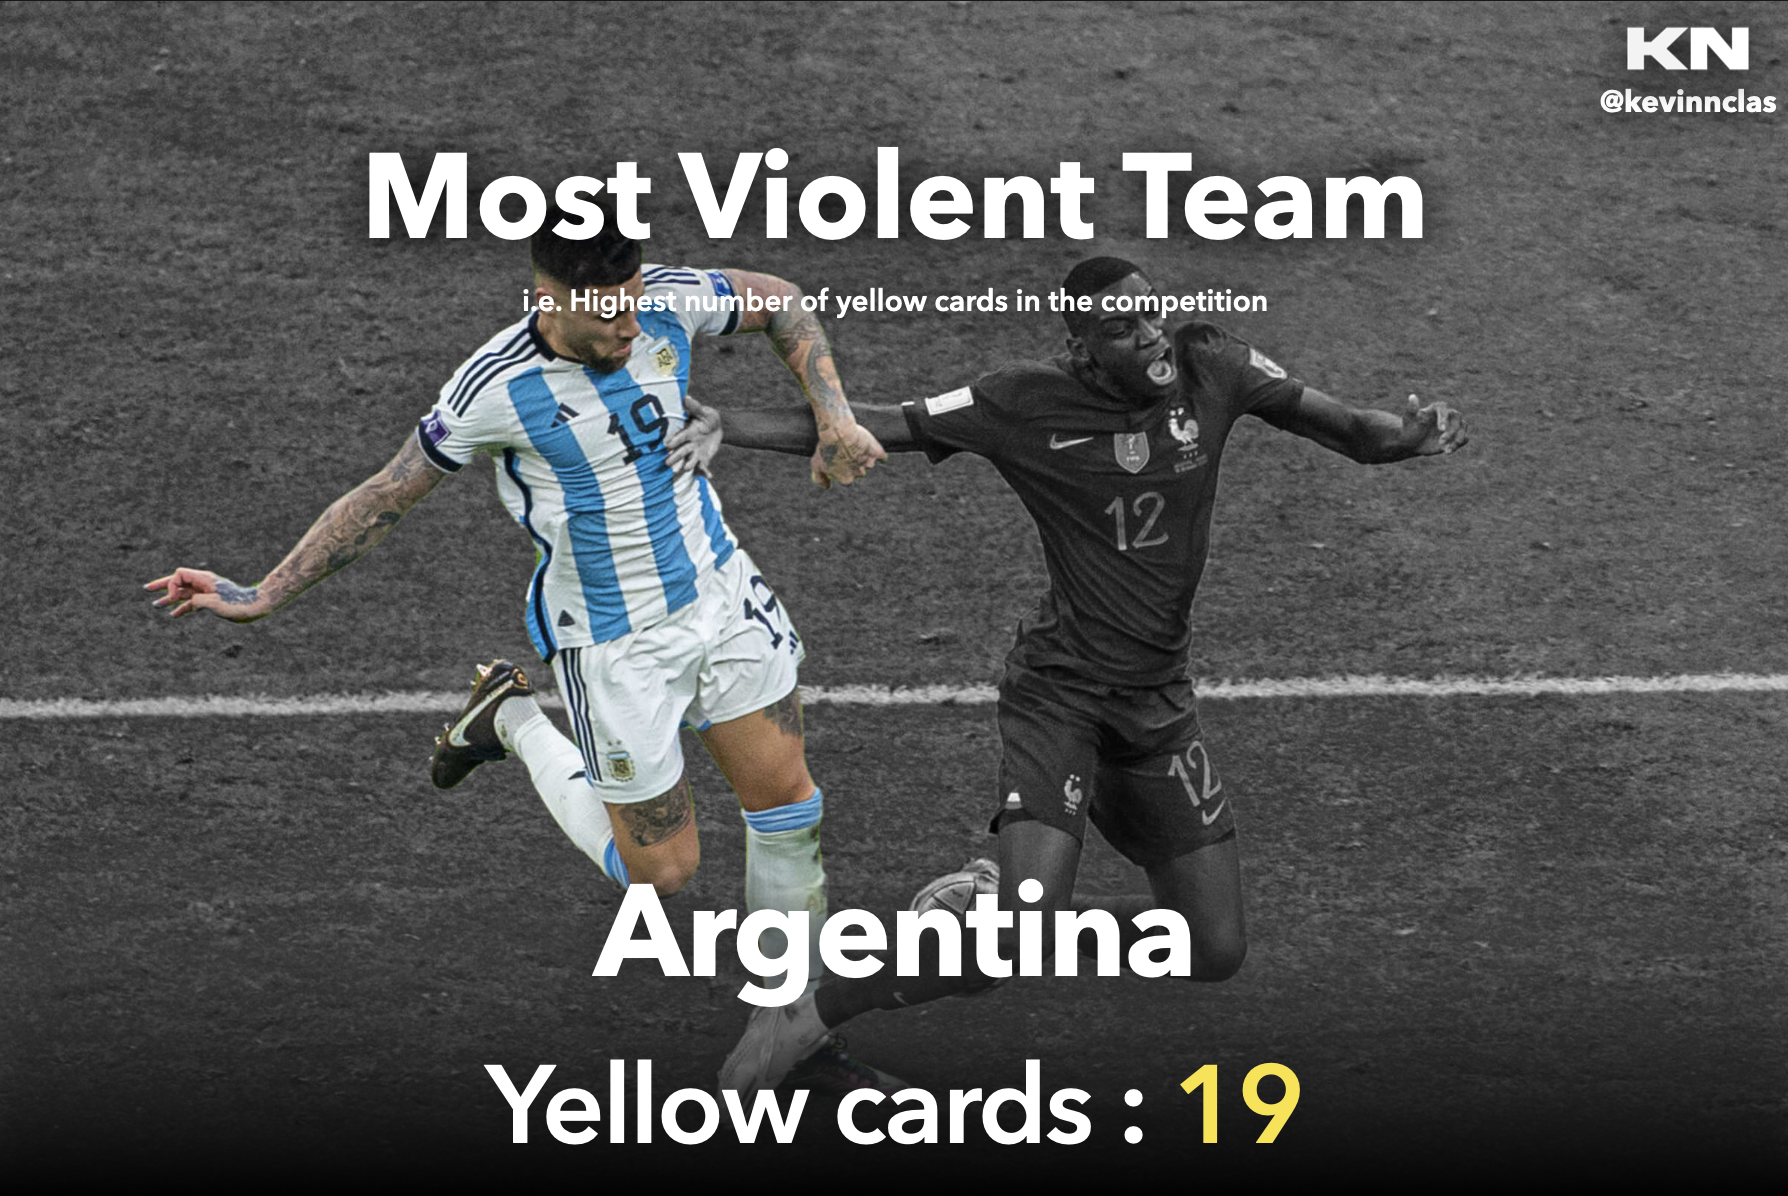
As a result, we can see that Argentina was the most violent nation during this World Cup, with 19 yellow cards received in only 7 matches. That's almost 3 yellow cards per match, which is not a very good metric to be proud of for a World champion.
Most boring match 😴
With 64 matches occuring during the World Cup, it happens that some matches are not very exciting. I wanted to know which match was the most boring one, according to the number of shots that happened during the game:
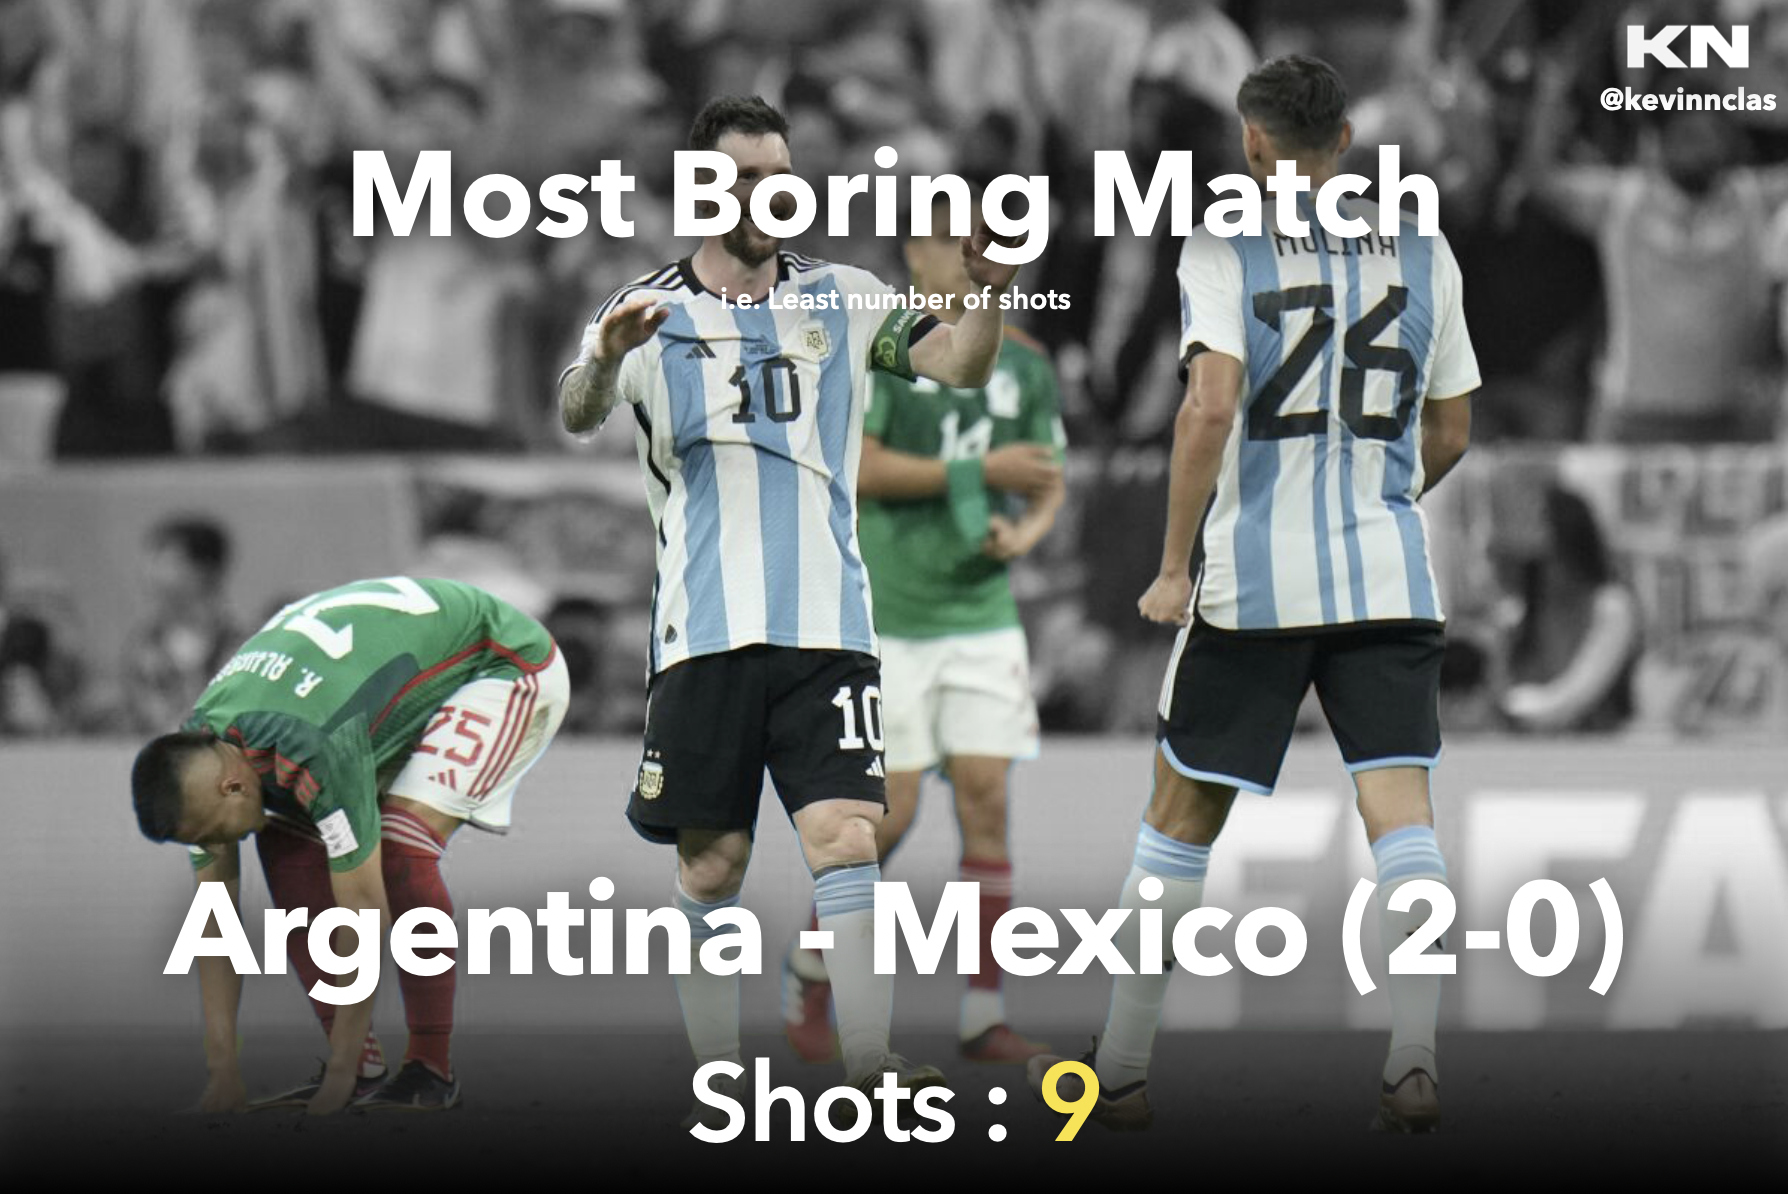
With two nations from South America including the World champion of the competition, Argentina - Mexico was the most boring match to watch, with only 9 shots. Fortunately for the spectators, the score was not a null score but a win 2 - 0 for Argentina. During the match, Argentina shot 5 times and Mexico 4 times.
Most dangerous team 🎯
This metric is representing the team which has the highest rate of shots on target on all the competition.
Because every team didn't have the same amount of shots, I also normalized the rate of shots on target by the number of shots of a team, to highlight the accuracy of teams that didn't had the opportunity to shoot often but were still precise enough to shoot on target. In our normalization case, it's like all the teams had the same amount of shots.
Let's see the results:
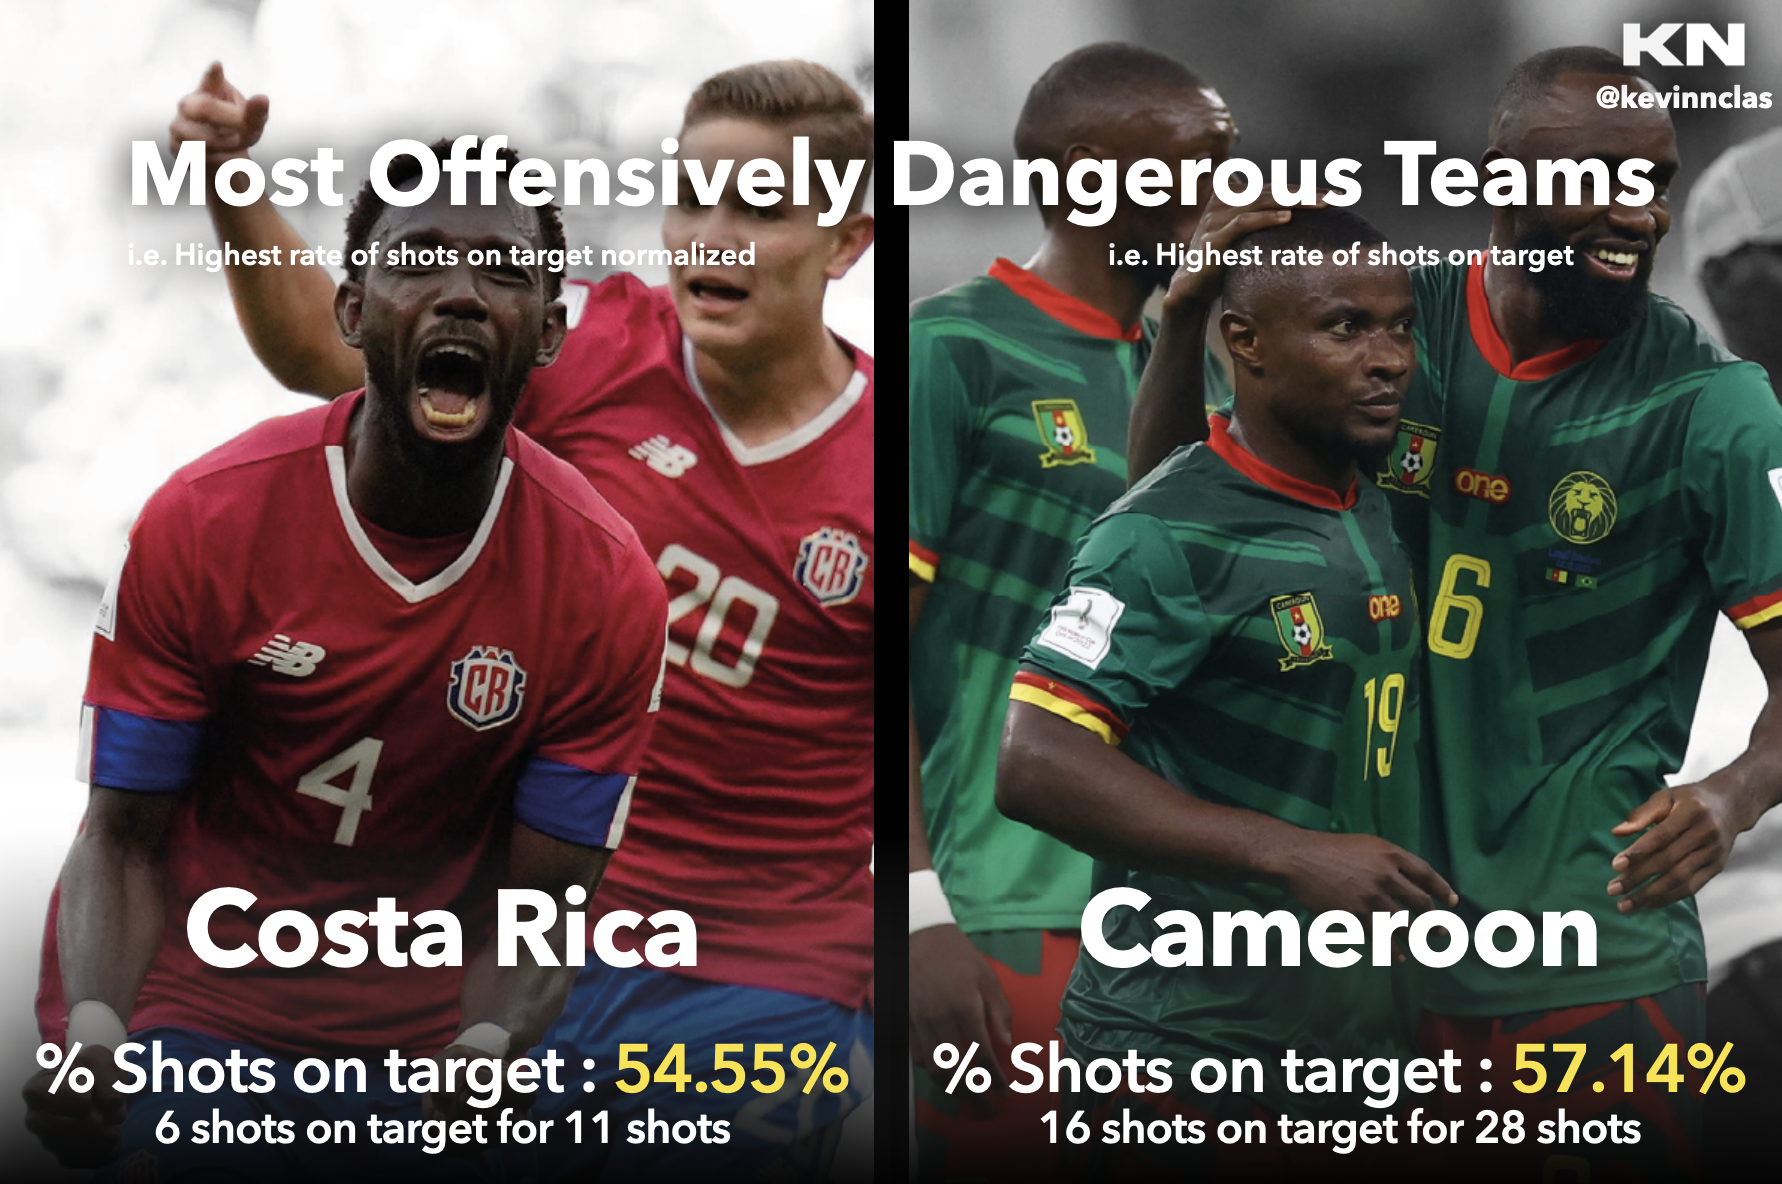
For the normalized metric, this is Costa Rica that was the most dangerous team and that has the highest rate of shots on target normalized by the number of shots, with a rate of 54,55% (score of 4,96 for the rate of shots on target normalized).
If we take the overall shots on target and shots without normalization, this is Cameroon that was the most dangerous team with a rate of 57,14% (score of 2,04 for the rate of shots on target normalized, 2nd best score of the 32 teams).
Youngest & oldest teams 👶👴
As we saw for the players, we will see which teams had the youngest and the oldest average age of the competition:
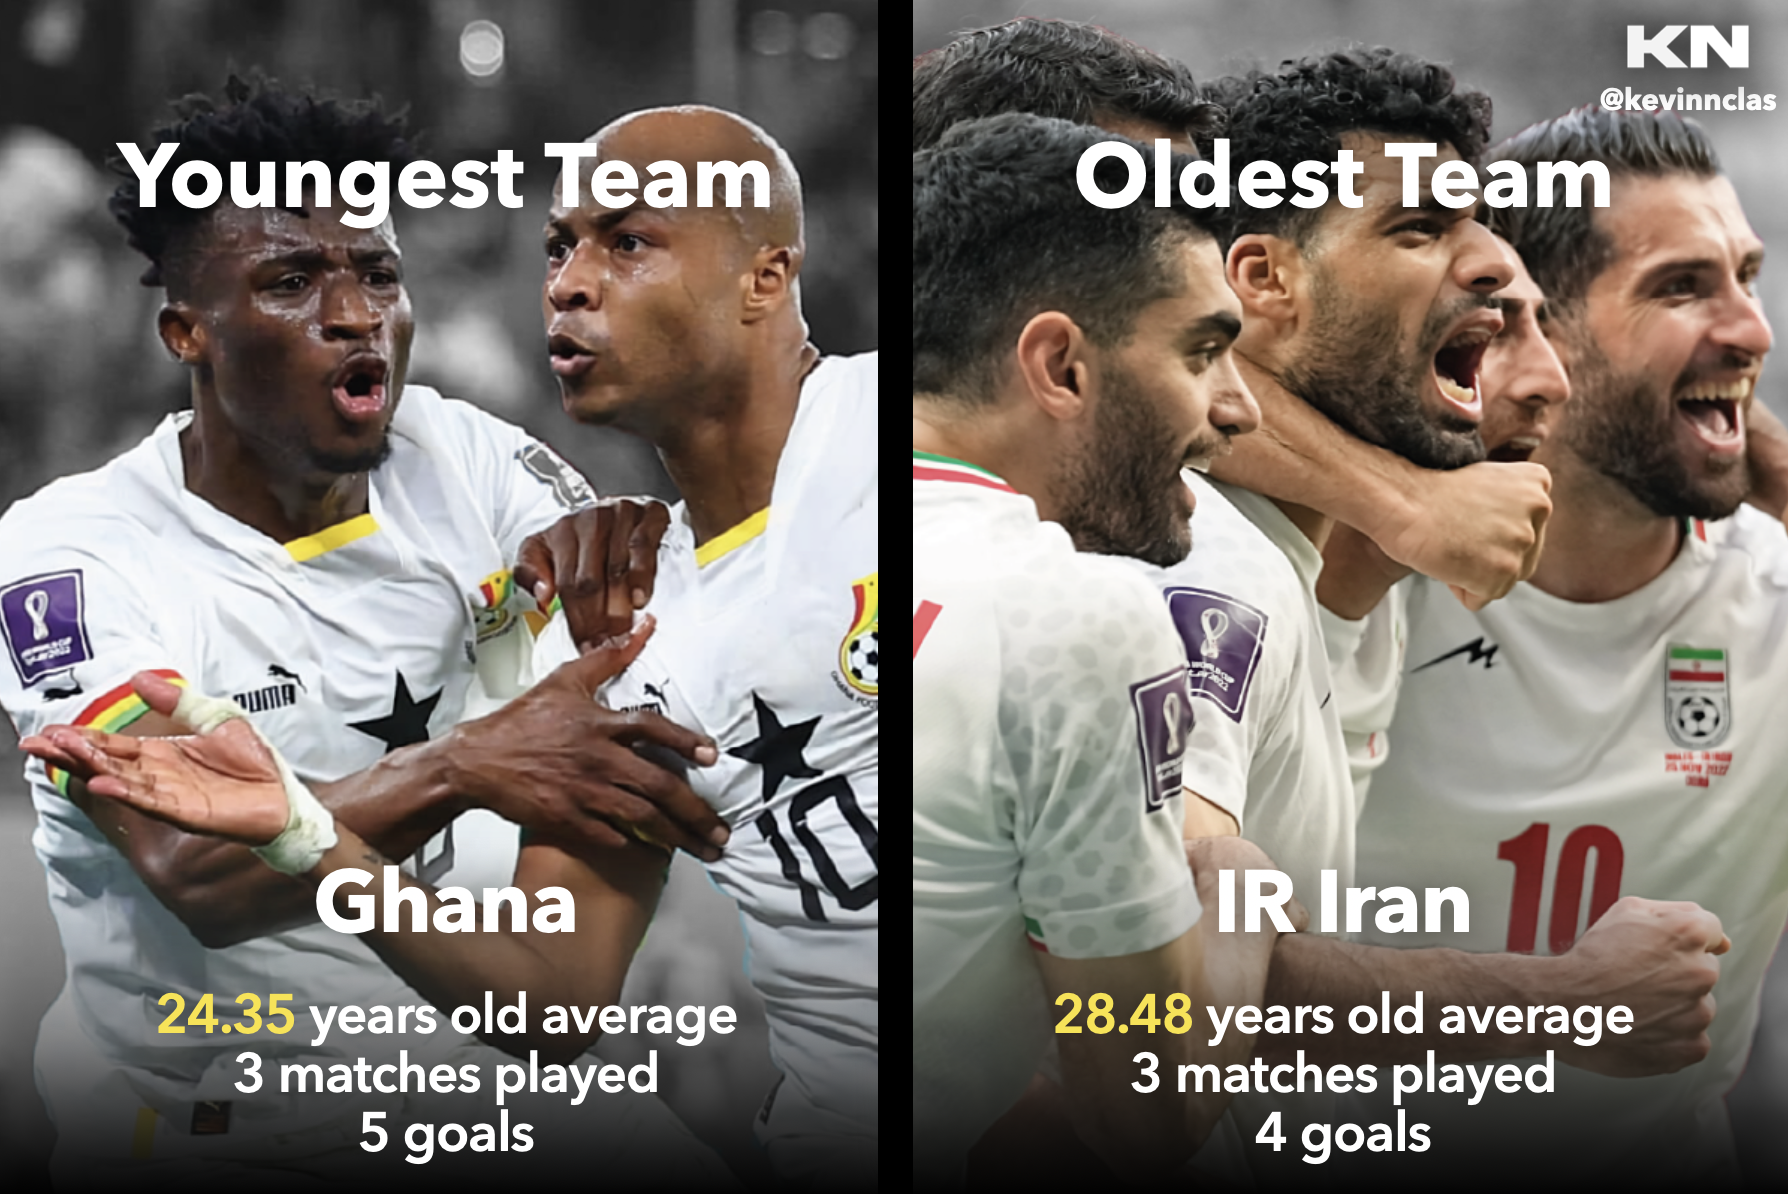
The youngest team of the World Cup is Ghana, with an average age of 24,35 years old. With 3 matches played, they managed to score 5 goals.
On the other hand, the oldest team is the Islamic Republic of Iran, with an average age of 28,48 years old. With also 3 matches played, they scored 4 goals.
Matches
Here are some matches that were interesting to watch during this World Cup, based on their sportive performances.
Largest gap in the score 🚀
With 64 matches, some of them were spectacular to watch. In particular the match with the largest goals gap, i.e. the match in which a team won with the biggest goals difference:
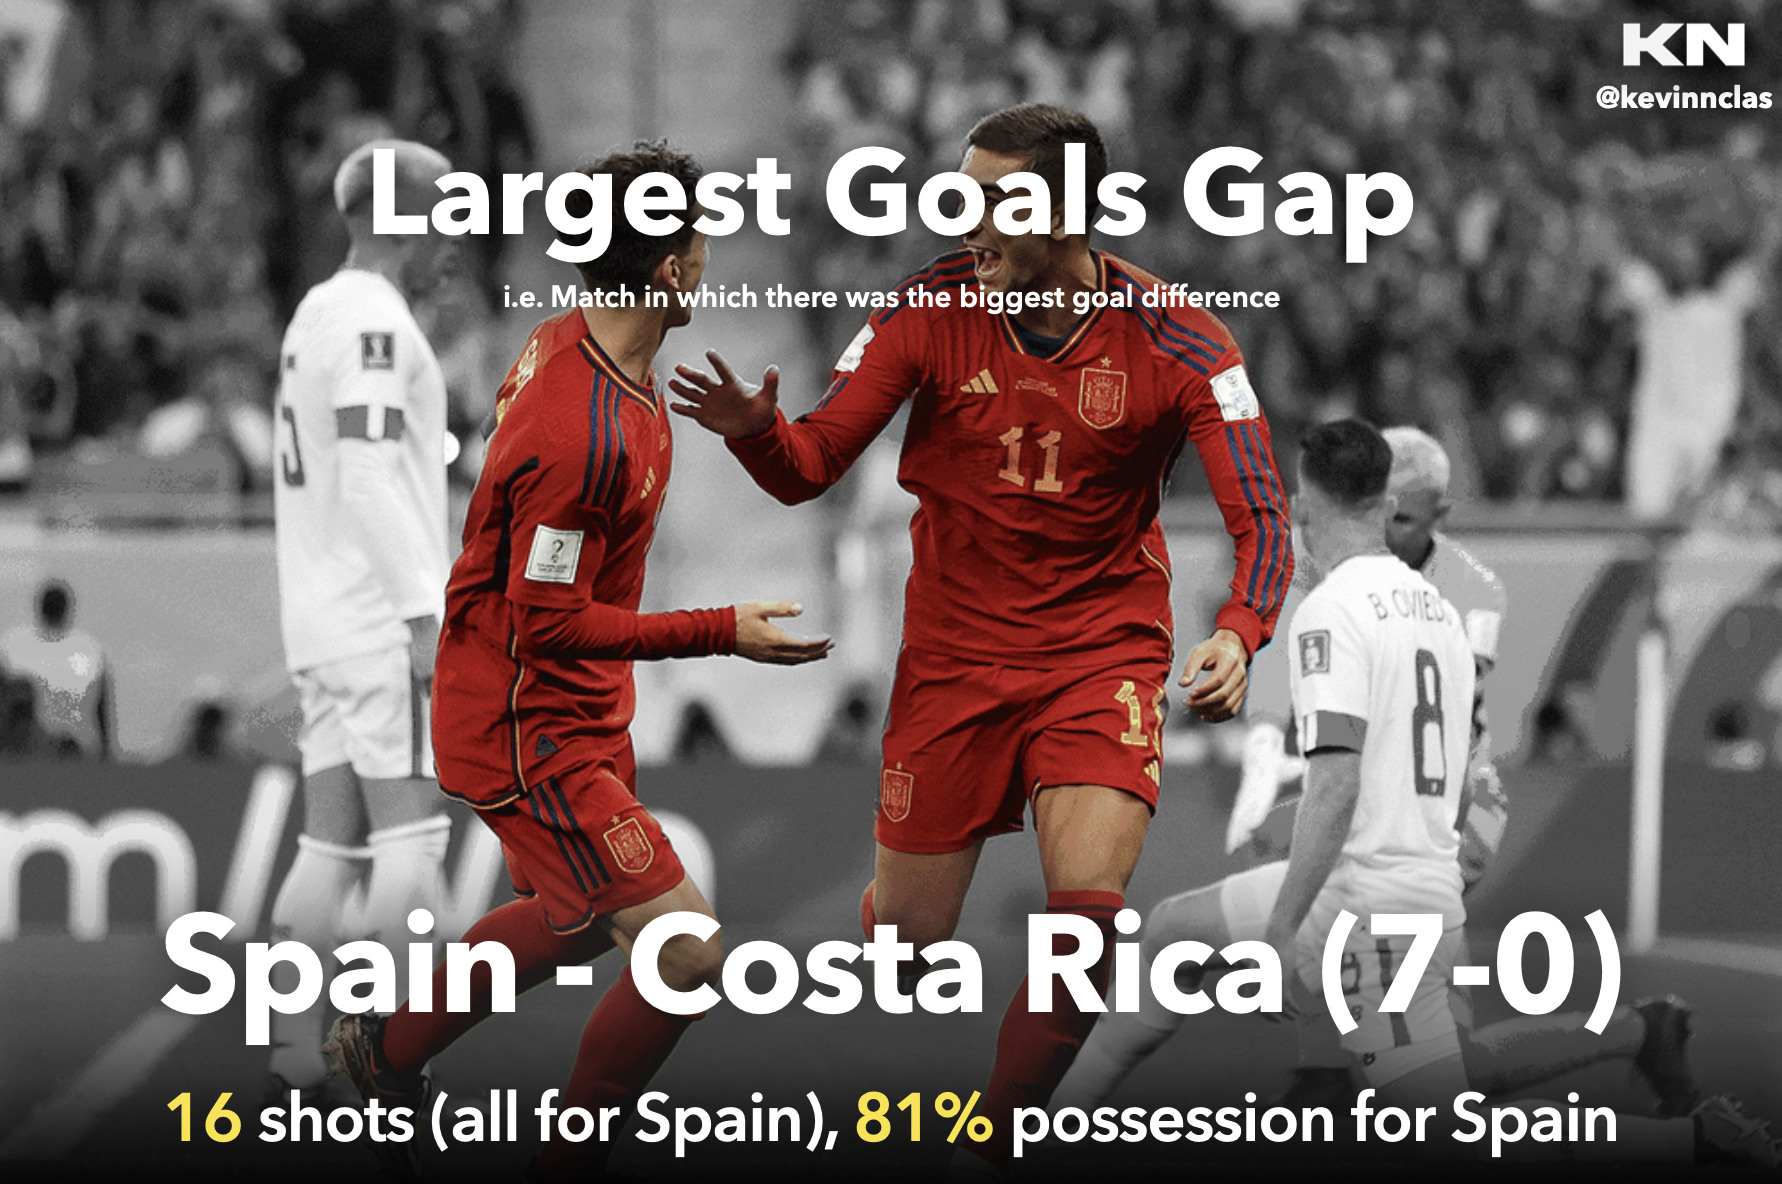
This match was Spain - Costa Rica with a score gap of 7 goals, resulting a win score of 7 - 0 for Spain.
In this match, they were 16 shots, all from Spain. Also, Spain had 81% possession of the ball.
Fastest goal ⚡️
Let's see now the fastest goal of the competition:
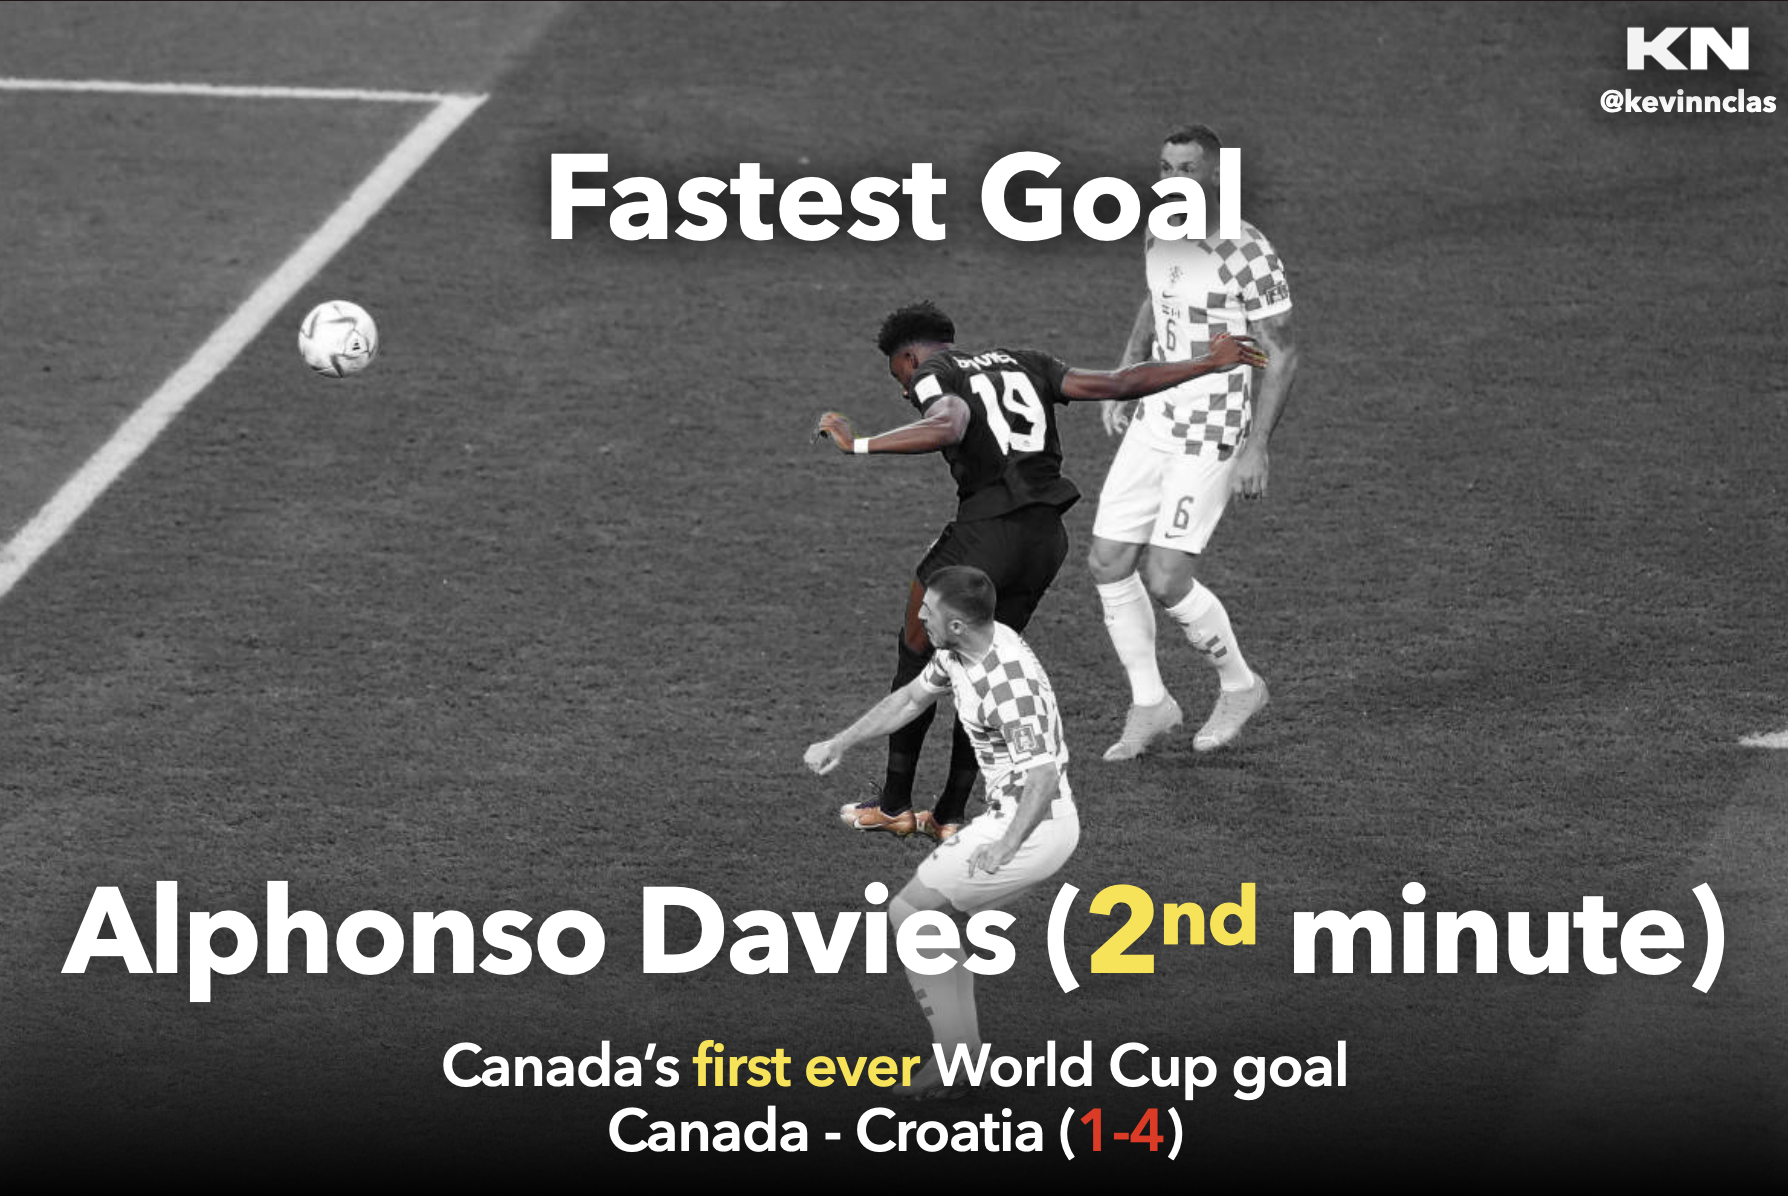
During the match Canada - Croatia, Alphonso Davies scored a goal header at the 2nd minute. This was the Canada's first ever World Cup goal.
Unfortunately for Canada, they lost 4 - 1 in this match against Croatia.
Latest goal ⏳
Now that we saw the fastest goal, we will see the latest goals of the competition:
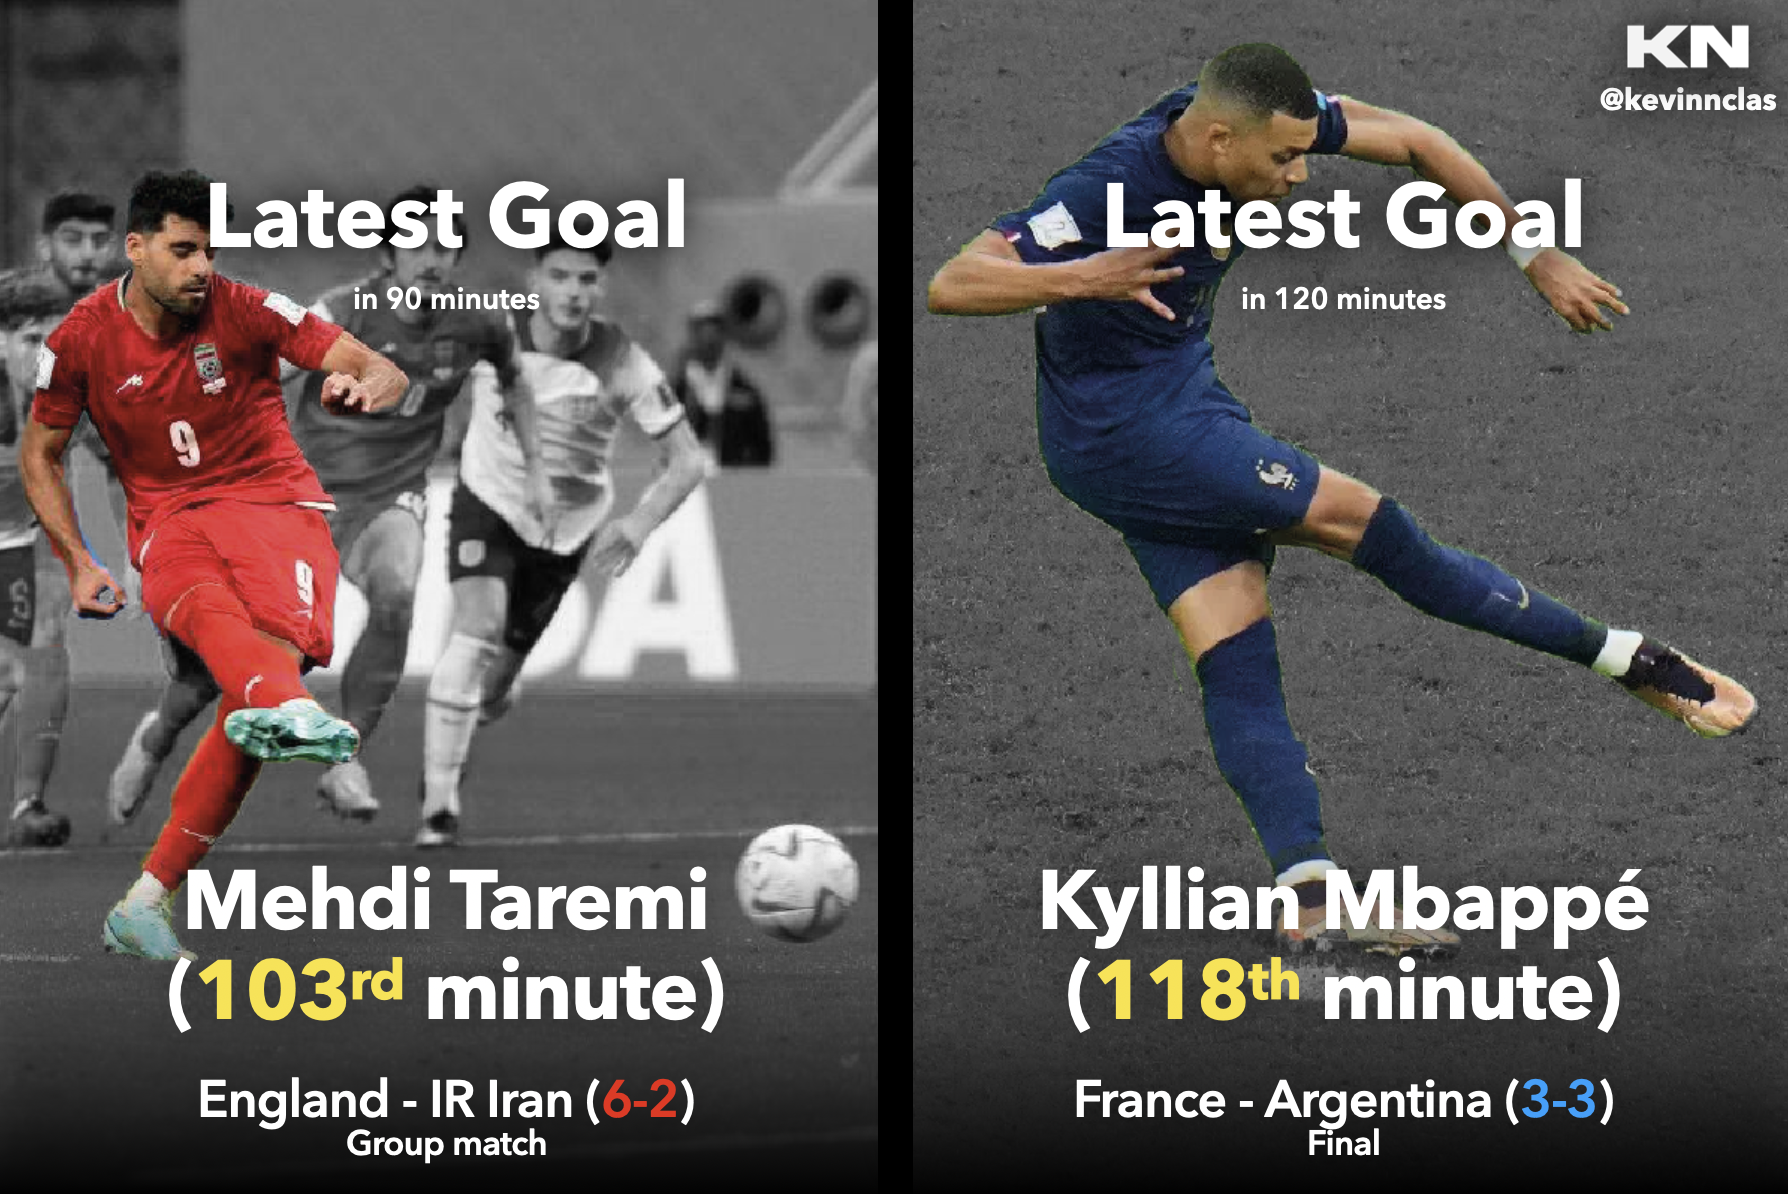
In the regulation time of 90 minutes, the latest goal during a match of the competition is the one of Mehdi Taremi who scored a penalty kick at the 103rd minute against England.
Unfortunately for IR Iran, they lost 6 - 2 in this group match against England.
Taking into account the extra time, the latest goal during a match of the competition is the one of Kylian Mbappé who scored a penalty kick at the 118th minute against Argentina, to get the draw against them.
Unfortunately for France, they lost in the penalty shootout in the final against Argentina, after a draw of 3 - 3.
Coaching
In this section, we will see some metrics about good coaching decisions that happened during the World Cup, based on the teams' performances.
Most effective coaching ✅
As an effective coaching, I wanted to see which coach had made the most substitutes of players who scored or made an assist:
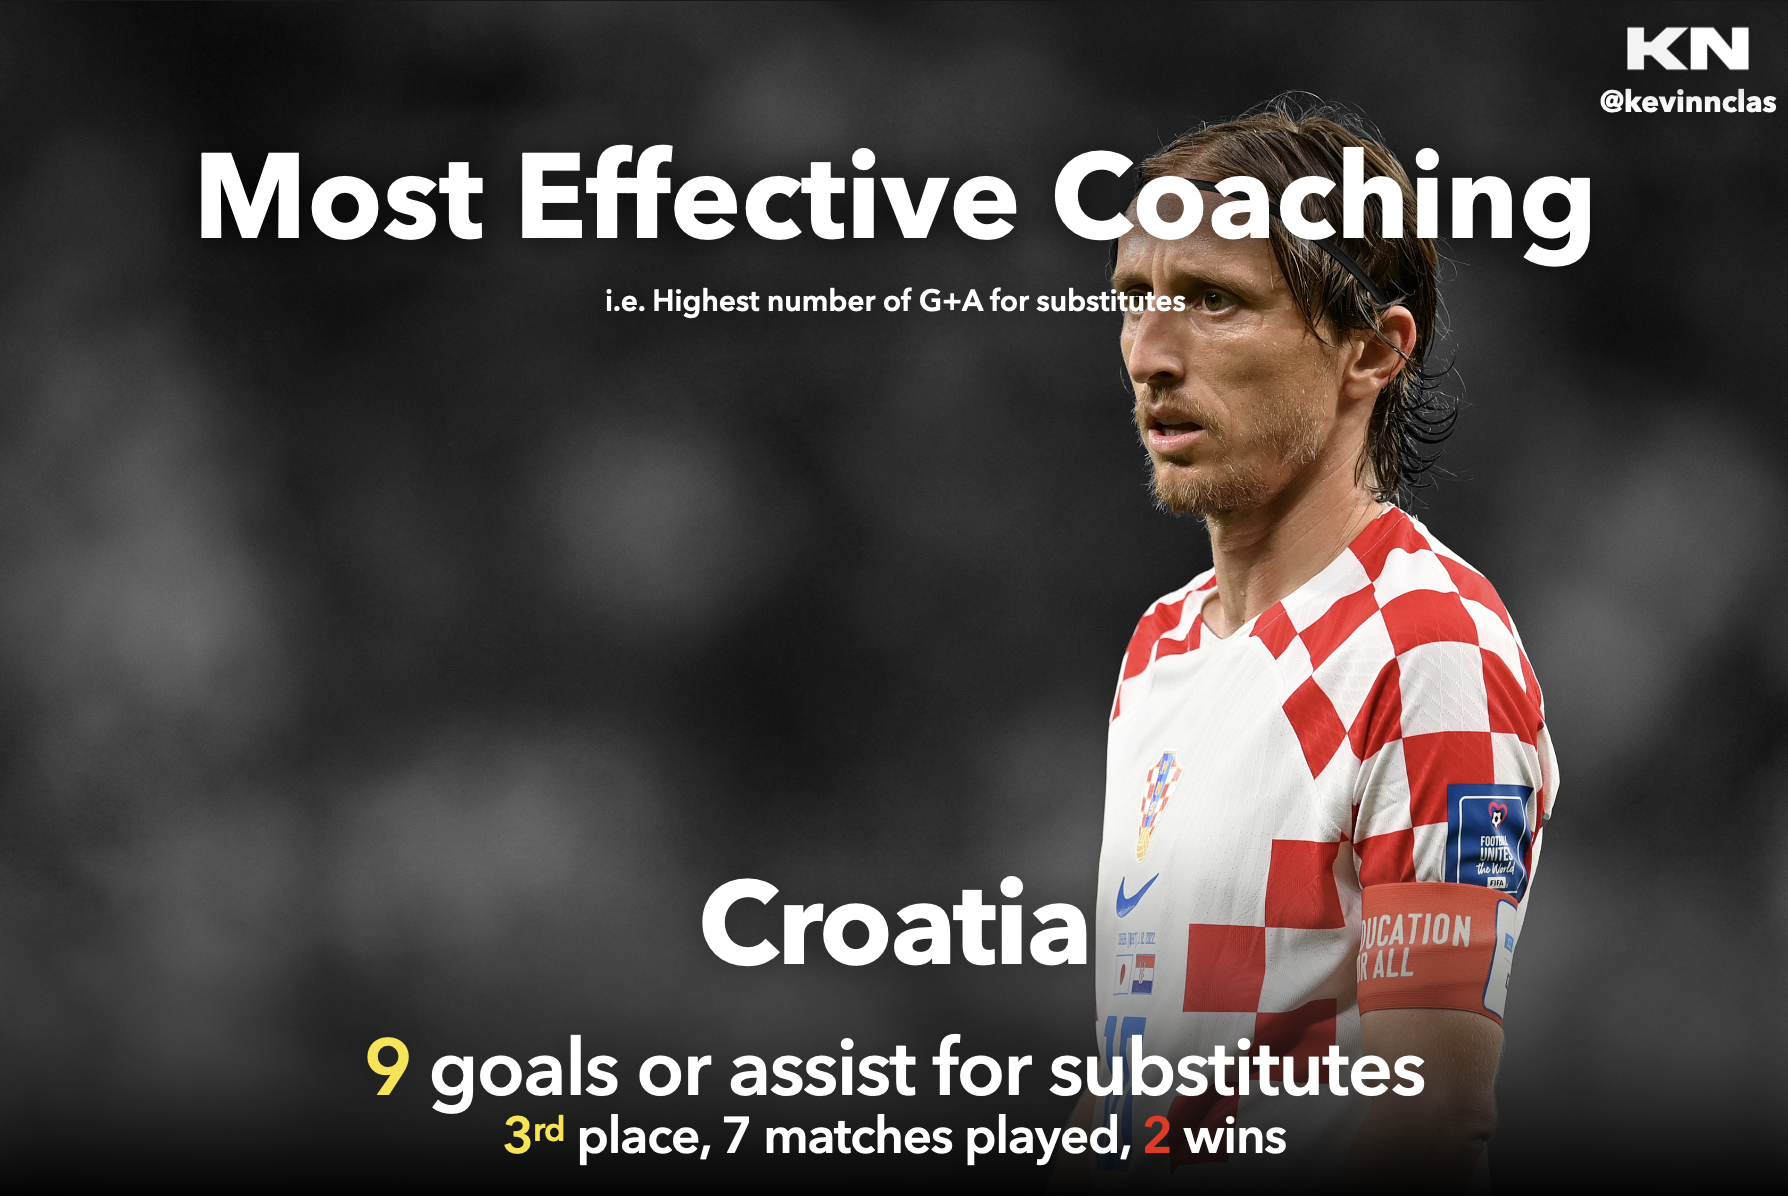
Without many surprise, Croatia had the best coaching, with 9 substitutes players that scored or made an assist in this World Cup.
Zlatko Dalić, coach of Croatia since 2017, had an important role in the success of Croatia in this competition.
In fact, they finished at the 3rd place, with 7 matches and only 2 wins. To go this far without winning that much, we can see the strength of Croatia's coaching.
Fastest substitute to score 💡
To unlock a match, sometimes a coach has to replace a player with another. We will see which substitute was the most prolific, i.e. the goal scored by a substitute with the smallest time gap between his entrance and the time he scored:
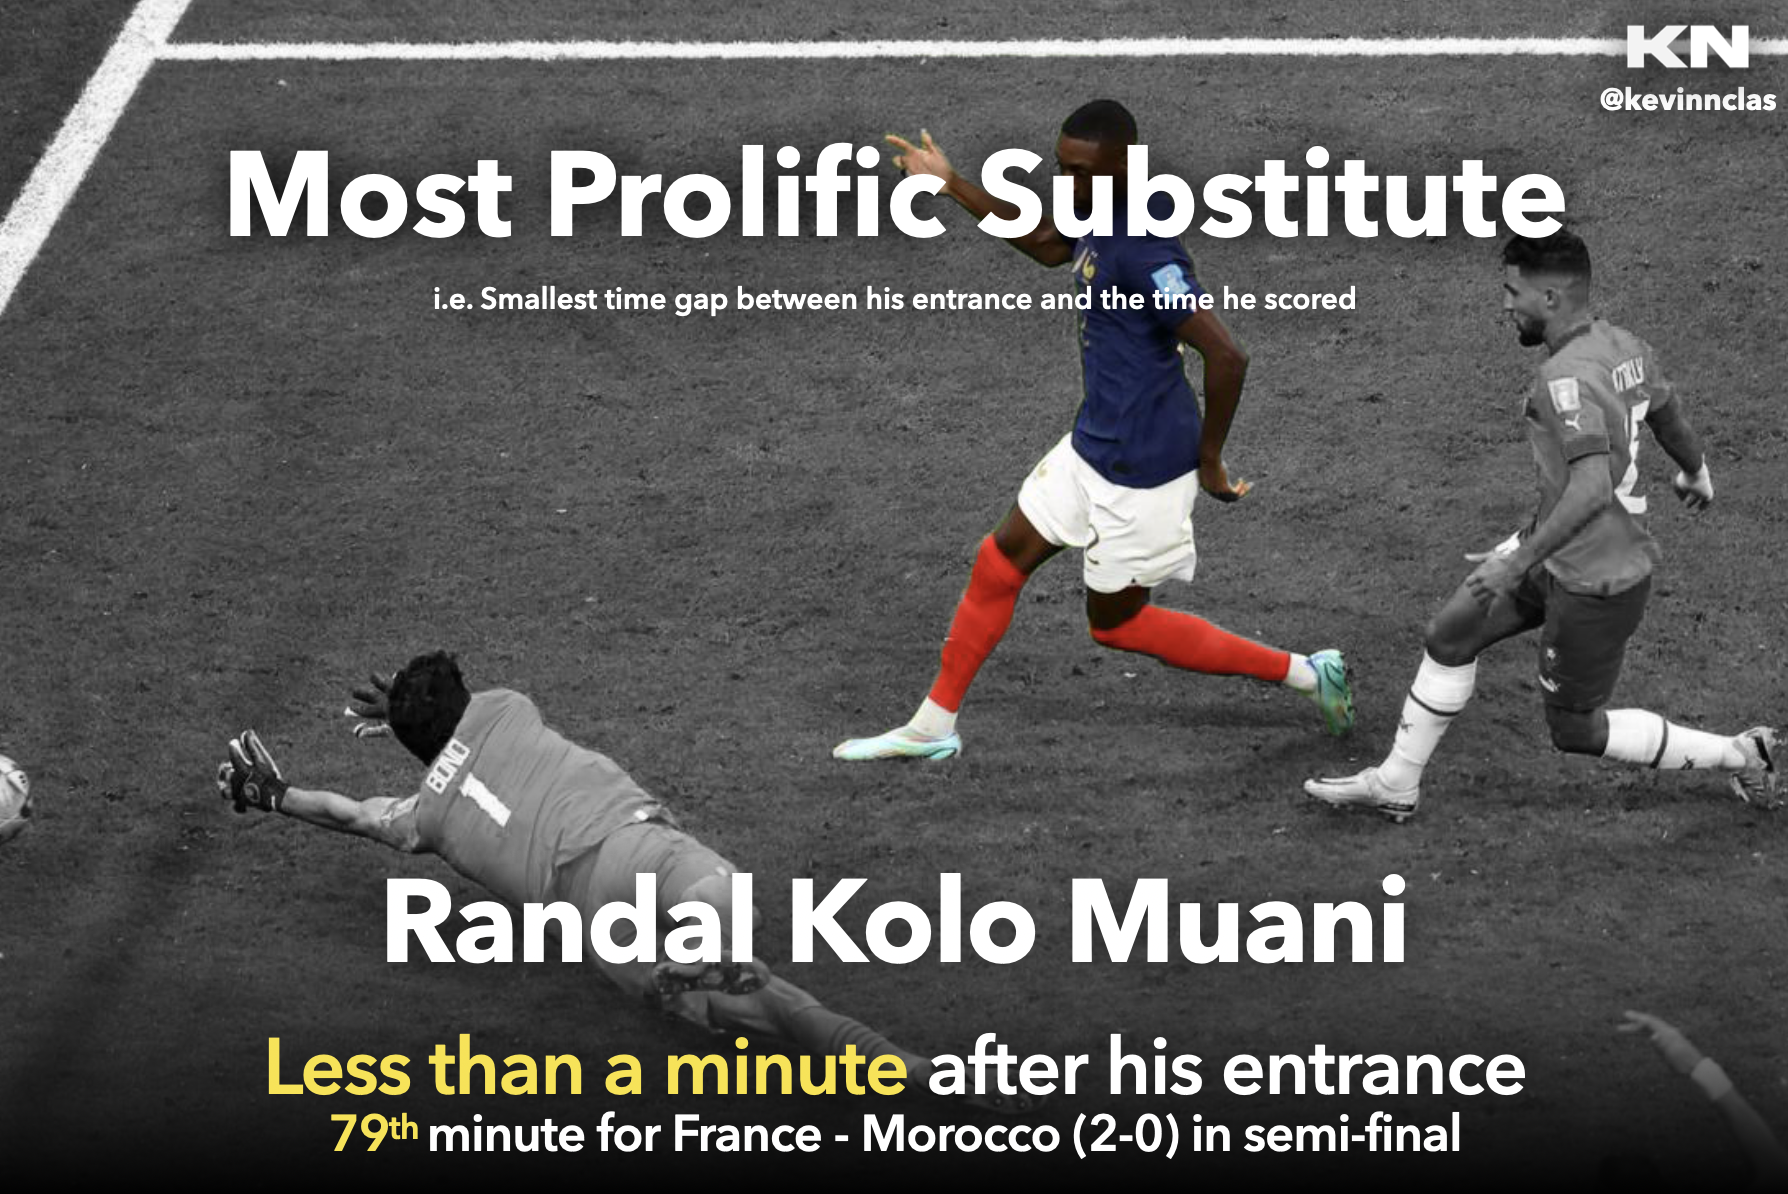
This substitute is Randal Kolo Muani, during the match France - Morocco. He entered at the 79th minute, and less than a minute after, he score the 2nd goal for France in the semi-final.
Thanks to Didier Deschamps, coach of France since 2012, Randal Kolo Muani scored his first World Cup goal ever at the age of 24.
Comparison of World Cups
Let's compare this 2022 World Cup with the other editions that happened since 1998 (with 32 teams), based on the sportive performances.
Global statistics 📊
We will compare the differents World Cups since 1998 on global statistics like number of goals, yellow cards and red cards.
We can start by looking at the number of goals for each World Cup's edition since 1998:
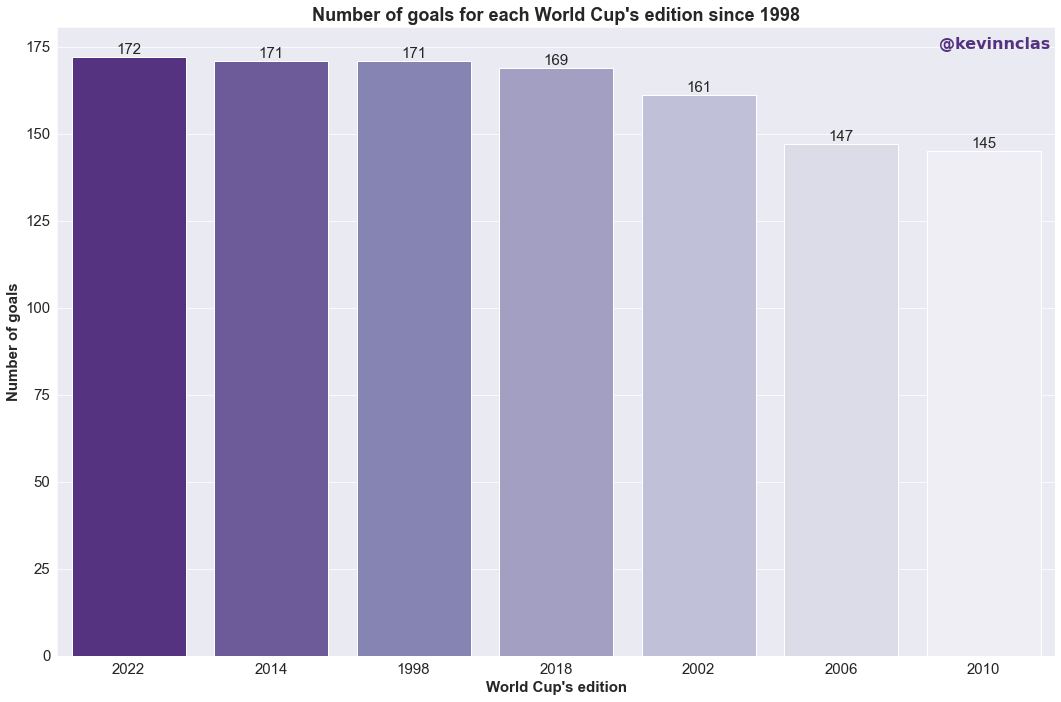
We can see that this 2022 World Cup is the most prolific edition since 1998, with 172 goals.
Now, let's see the number of yellow cards for each World Cup's edition since 1998:
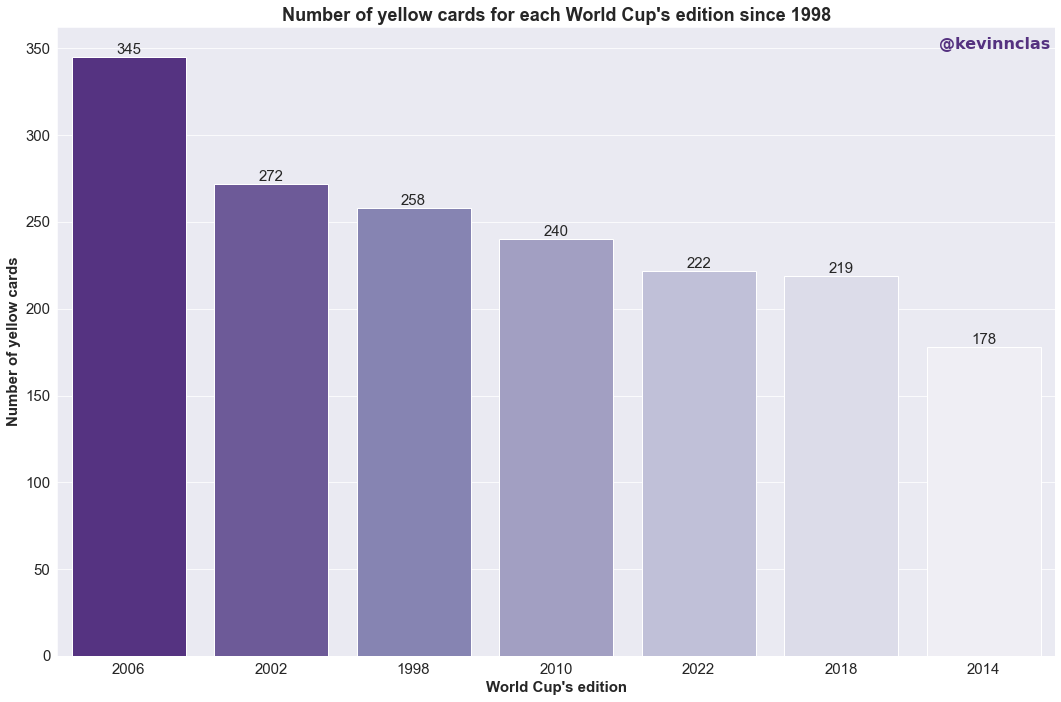
We can see that the 2006 edition was particularly violent with 345 yellow cards. As for the 2022 World Cup's edition, it's only the 5th place out of the 7 editions since 1998, with 222 yellow cards.
Finally, let's see the number of red cards for each World Cup's edition since 1998:
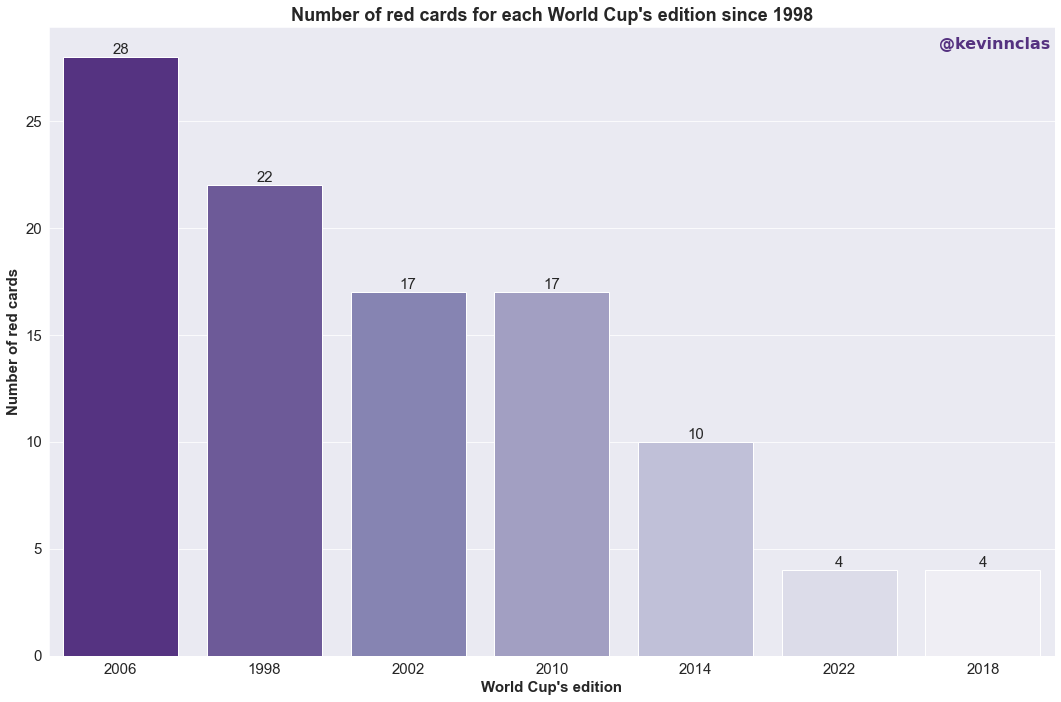
Again we see that the 2006 edition was the most virulent edition with 28 red cards. As for the 2022 World Cup's edition, it's the last edition in number of red cards since 1998, with only 4 red cards, on a par with the 2004 edition.
Continent's participation 🌍
In this part, we will see the number of countries, per continent, who participated in the final round of this 2022 edition:
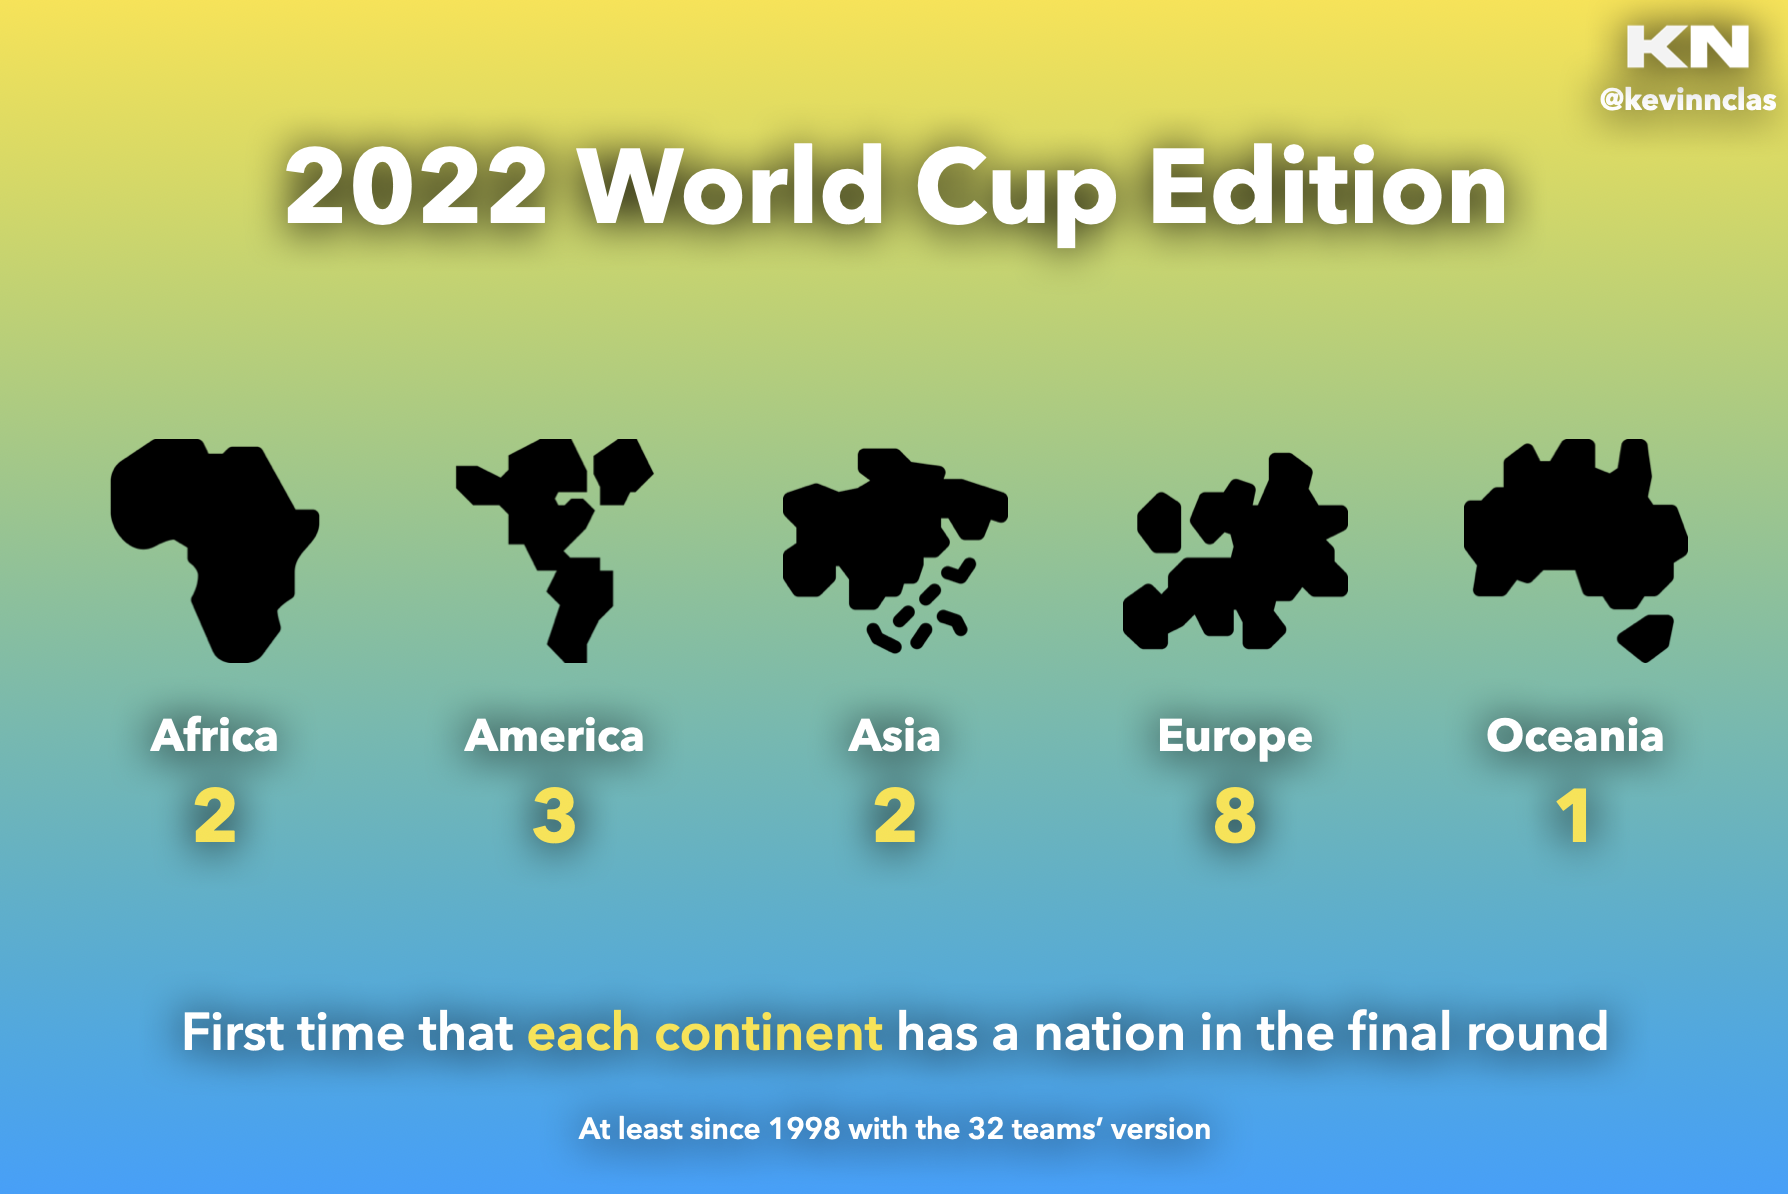
For the first time since at least 1998, every continent is represented by at least one country in the final round of the World Cup.
For Africa, the countries that represented the continent are Senegal and Morocco. For America, it's USA, Brazil and Argentina. For Asia, it's Korea Republic and Japan. For Europe, the most represented continent, the countries are Spain, Portugal, France, Netherlands, Switzerland, Croatia, England and Poland. Finally, for Oceania, it's only Australia.
It can shows the rise of the global level of football in the world, and it will be interesting to see this repartition in the next edition.
NB: Here, we don't talk about confederations, but geographical continents. In fact, Australia is part of the AFC (Asian Football Confederation) and America is split in half, with CONCACAF (Confederation of North, Central American and Caribbean Association Football) and CONMEBOL (South American Confederation).
Going Further
During this 2022 edition, I noticed some specificities according to the form and tiredness of the players. In fact, this World Cup happened in the middle of a regular season, unlike the previous editions. Let's discuss of these metrics:
Average of additional time ⏱️
If you watched some matches during the World Cup, you probably noticed that there was a lot of additional time added, unlike in the regular season.
This happened because the FIFA's objective was to increase effective playing time. See the average of additional time on all the competition:
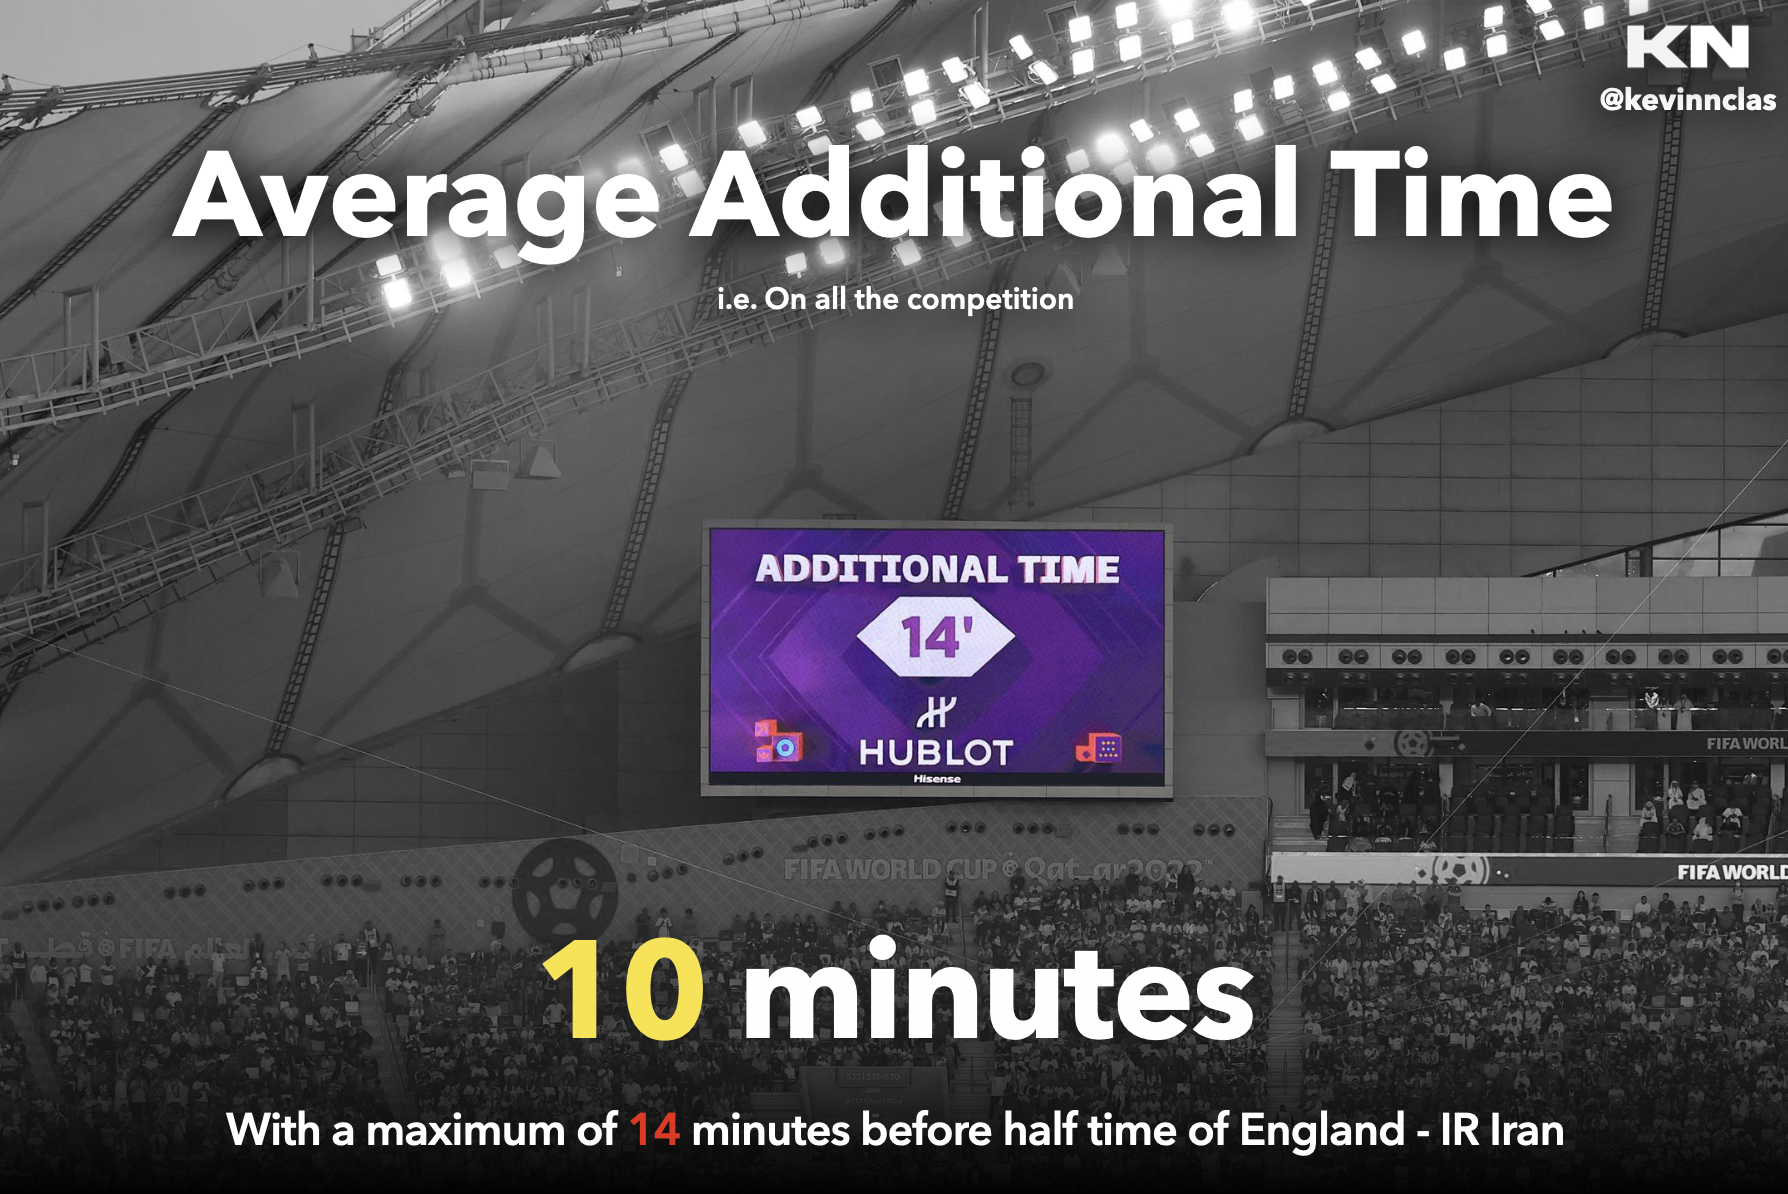
On average on this World Cup, there was more than 10 minutes of additional time by match. In total, that was 650 minutes played in additional time in 64 matches played.
The maximum additional time during a half of a match was 14 minutes. It happened during the first half of England - IR Iran.
Rate of injured players among substitutes 🩺
During this competition, we saw a lot of injured players, maybe because the fatigue accumulated during the first part of the regular season. I wanted to see the rate of players being replaced due to injury compared to the overall number of players being replaced on all the competition:

During the 64 matches, there were 587 substitutes made by the coaches. Among them, 38 substitutes were made because a player was injured and not able to play anymore. As a result, 6,47% of all players being substituted were injured.
Maybe it's because the players are more tired and easily injured, after a first part of the regular season.
Most prolific half ⚽️
To finish my analysis, I wanted to see which half of a match was the most profilic in terms of average goals scored, and see if there was any difference:
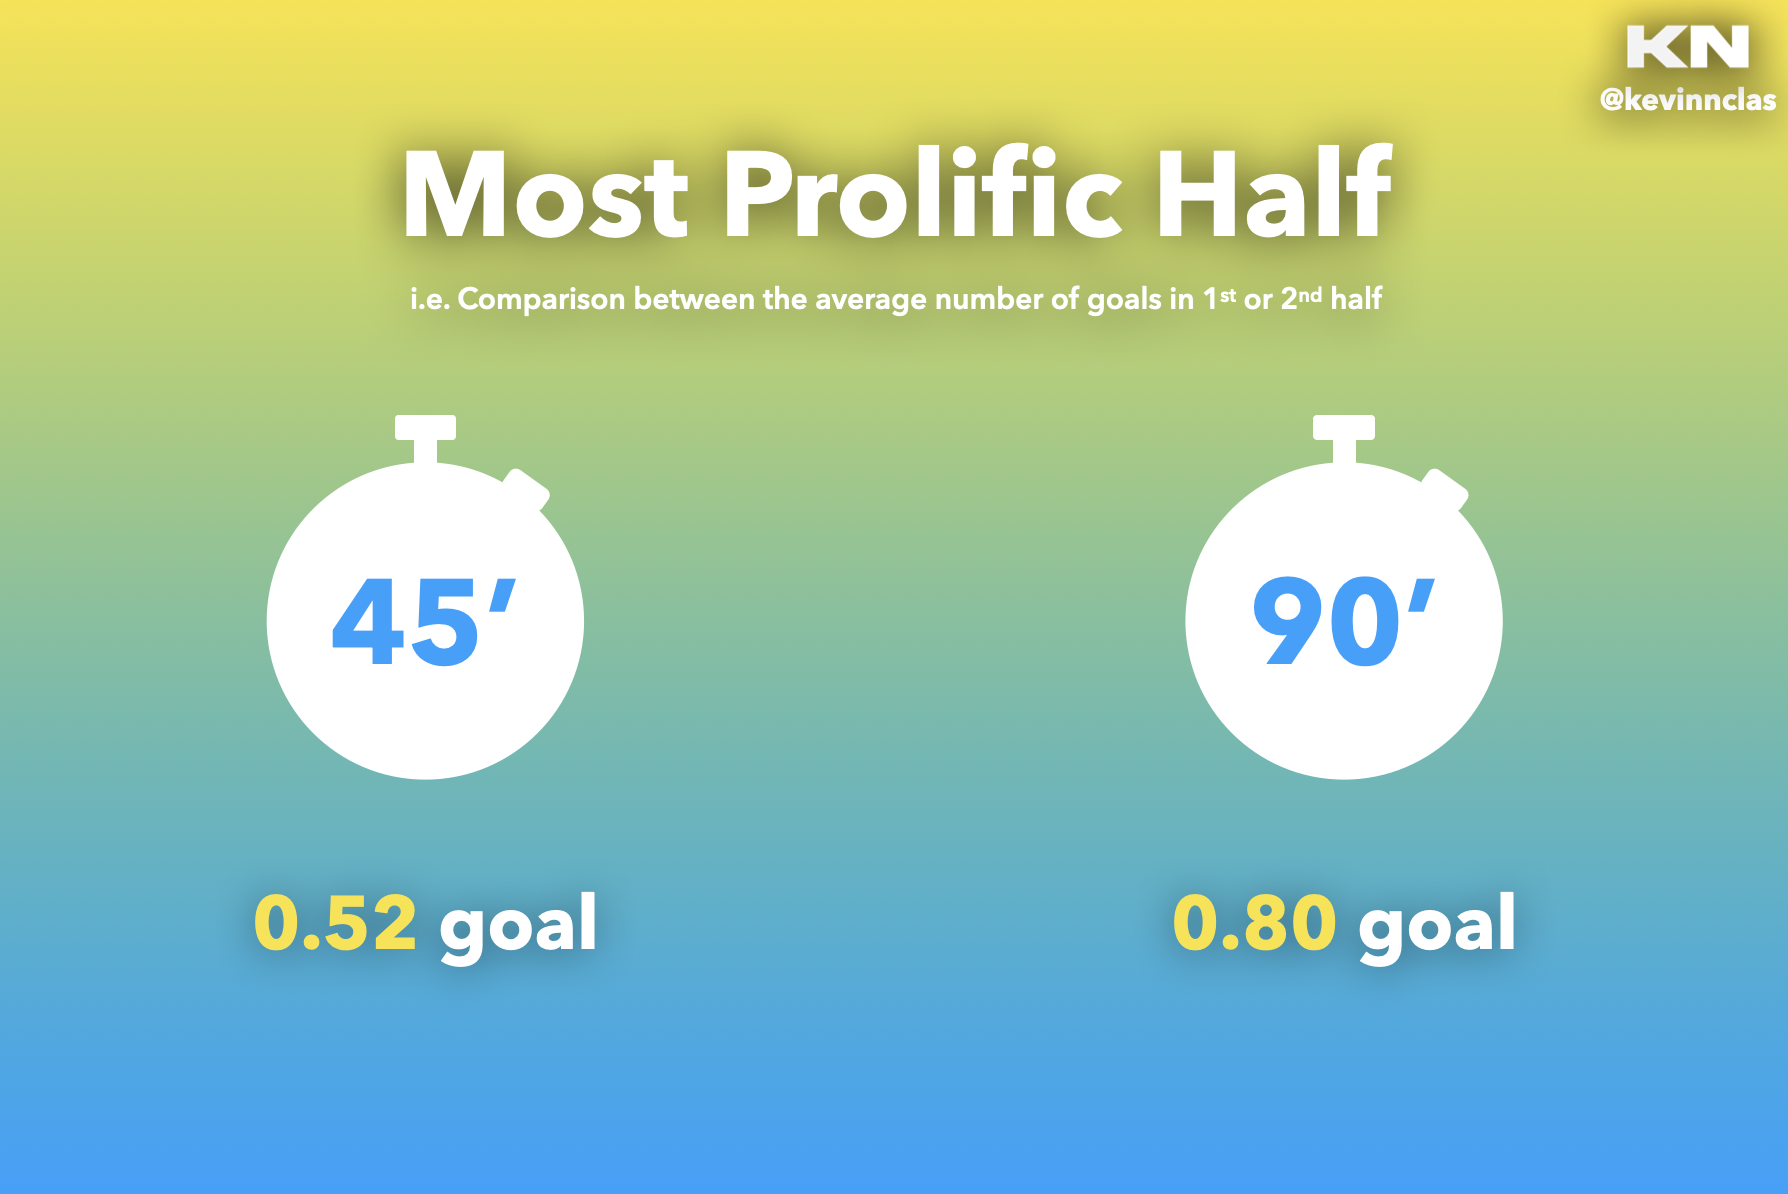
As we can see, 0,52 goal was scored during the 1st half. As for the 2nd half, it's 0,8 goal that was scored.
Maybe it's because the teams are not enough confortable in the 1st half to be too much attacking, and matches tend to be more released at the end of the match to try to win.
Thank you for reading !
I did this project because I love football and data analysis. This was a great opportunity for me to mix both of them and to challege myself with something I never did.
I really enjoyed gathering data from my various sources (fbref.com, flashscore.fr or wikipedia.com), creating my data files, exploring it, creating vizualisation to be easier for you to read and memorize, and finally writing and coding this article.
I am strongly considering starting the experience again with a new project, about other subjects that I am passionate about. Of course, if you have any suggestion, feel free to contact me!
You can check the notebook where I did all the data analysis right here.
Thank you very much for reading me and my work, I hope this will remind you of your good times during the World Cup!